
Note: In this exercise, we’re taking a problem (“How do I put a bunch of library catalog records on a map?”) and breaking it down into several smaller steps. We’re going to end up moving back and forth among a couple of different tools, and using each one to complete one particular part of the larger problem. This can end up being a little confusing, but I’ve tried to describe each of these steps deliberately. Take it one step at a time…
Step 0: Installation
Before you begin: I’m assuming you’ve installed Zotero and the English Short Title Catalogue site translators, that you’ve installed Open Refine, and that you have a Google Drive account.
Step 1: Finding records at the ESTC and adding them to Zotero
The English Short Title Catalogue is the most extensive and authoritative guide we have to books and periodicals printed in the English-speaking world before 1800. Your first task is to search the ESTC to find records for a book that was published in at least three different cities.
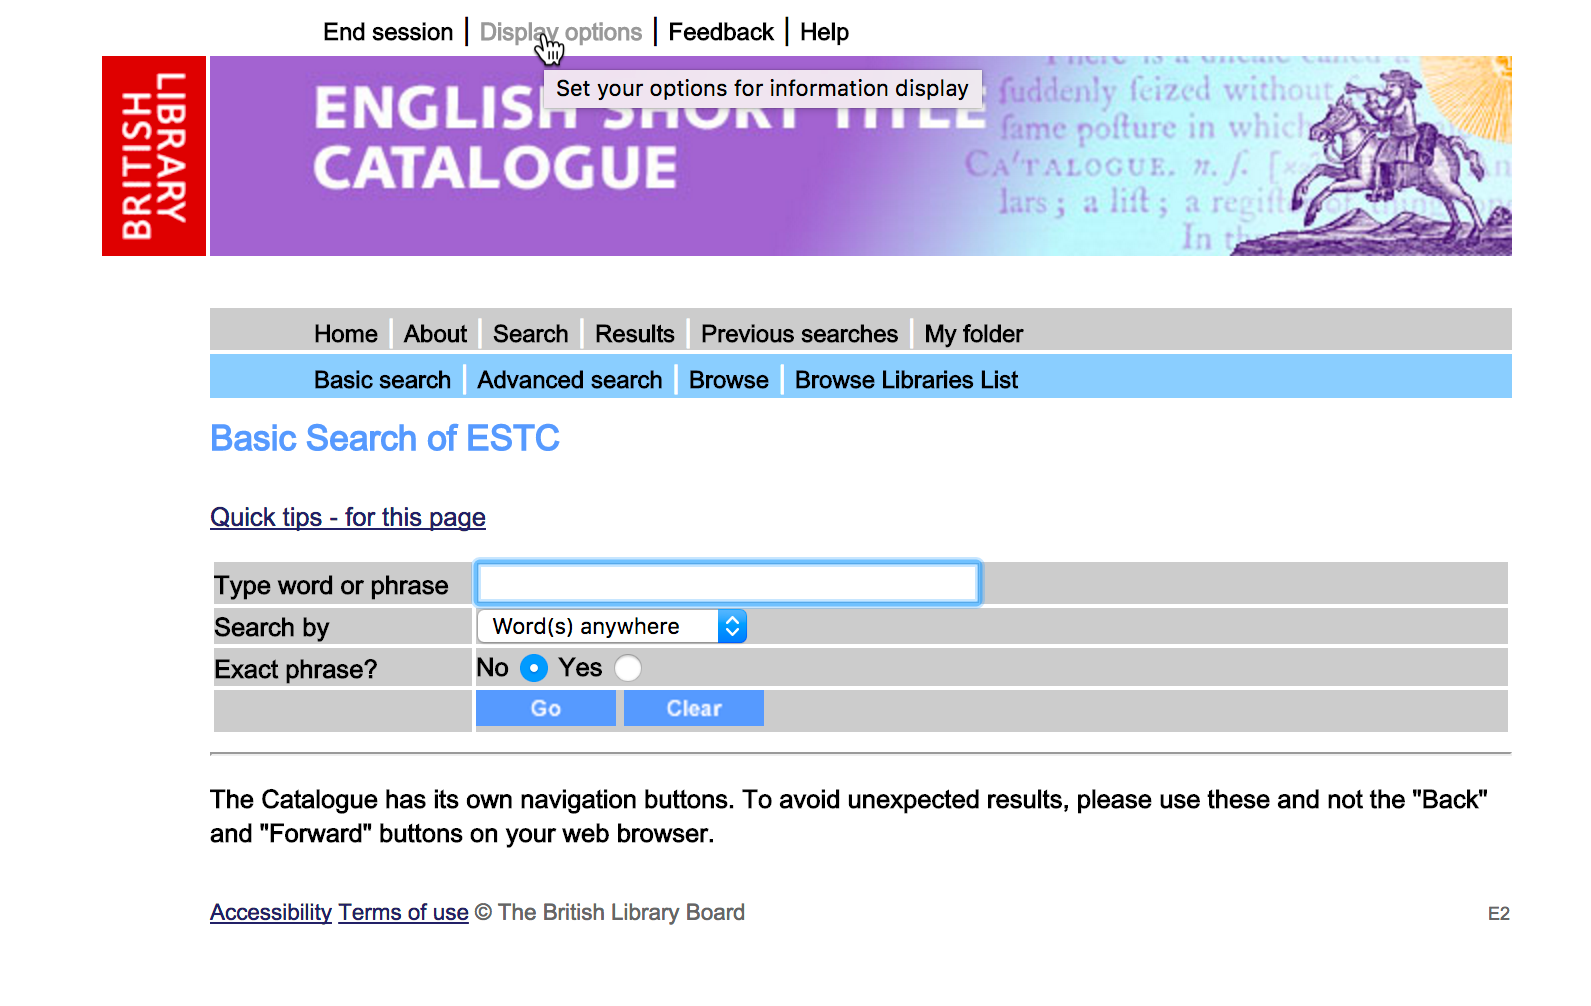
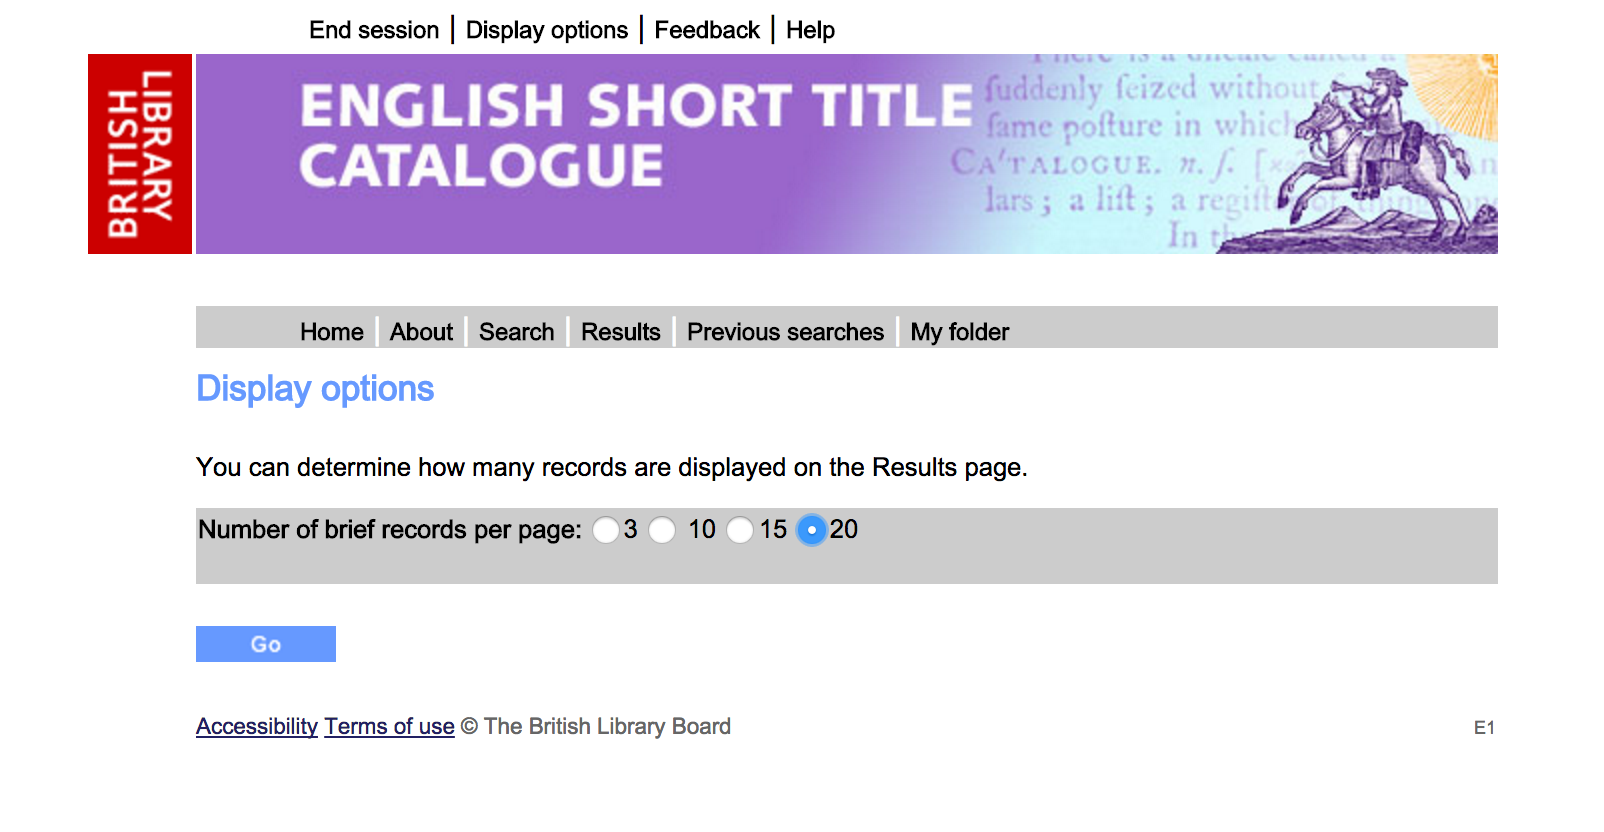
To make your life easier, first set the ESTC’s display options to show 20 records at a time (the default is ten records). [For all screenshots in this tutorial: click to enlarge.]
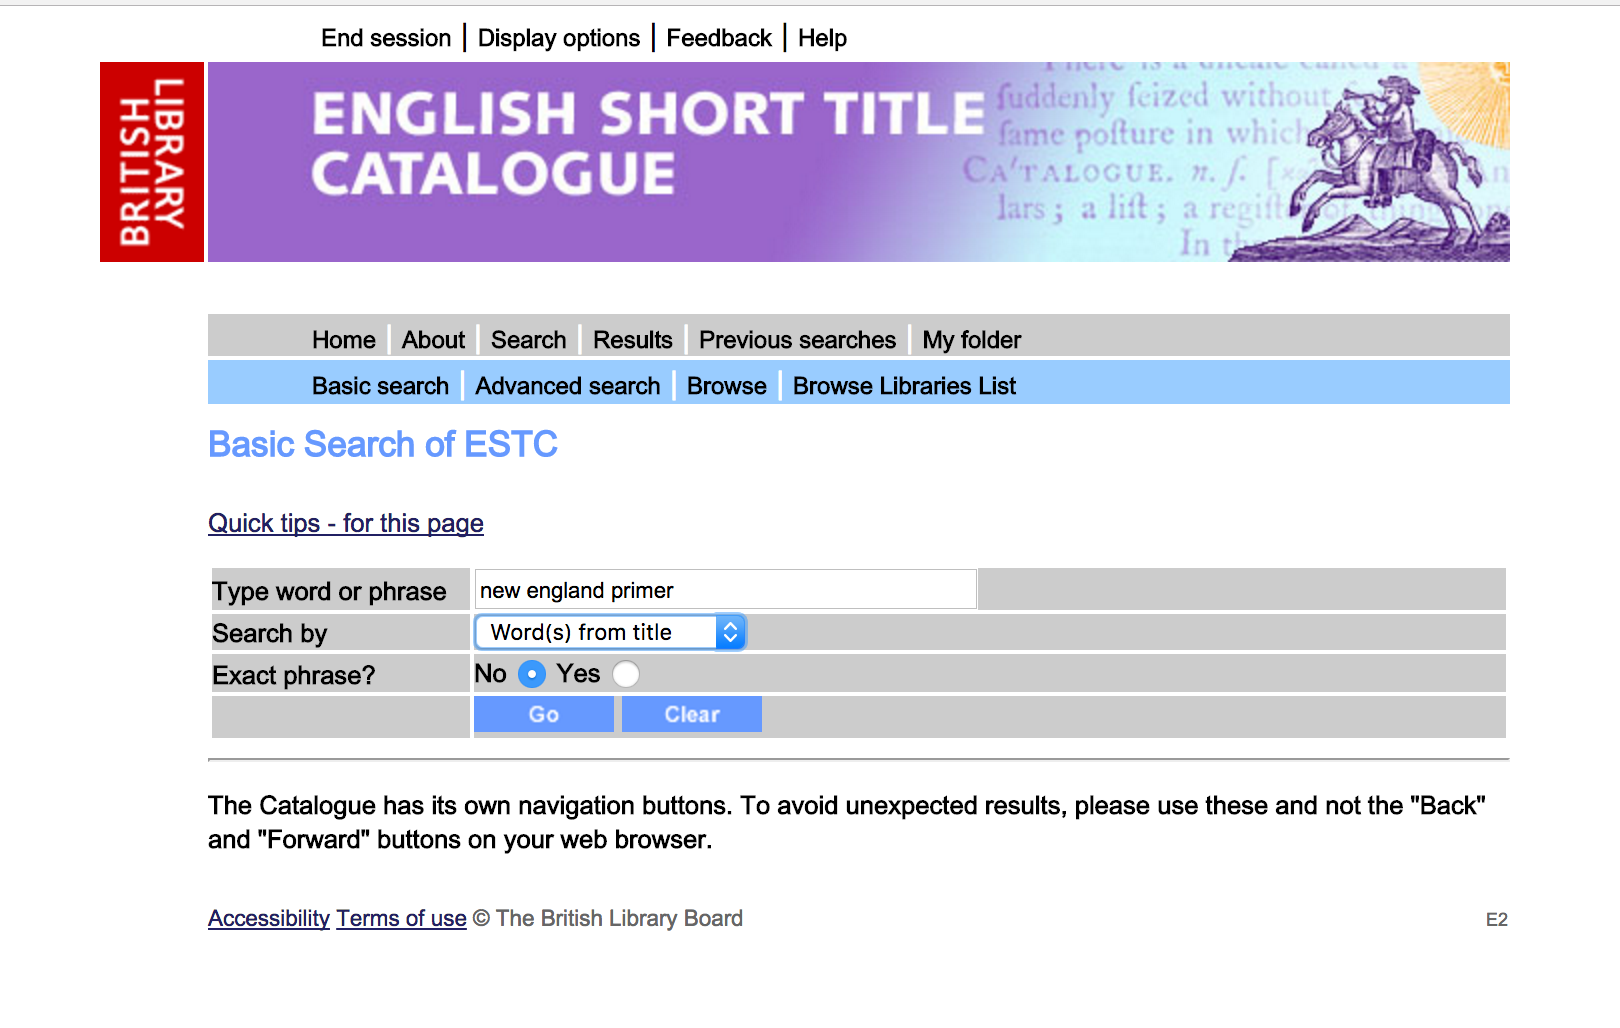
 All of the screen shots below are from a basic search for title “New England Primer.” You might start by searching for the title of a book you’ve already looked at in your local collection. (If your book turns out not to have been republished in multiple places, you might try one of the following searches: a basic author search for “Wheatley, Phillis;” an advanced search for author “Gray” and title “Poems;” an advanced search for author “Richardson” and title “Virtue Rewarded.”)
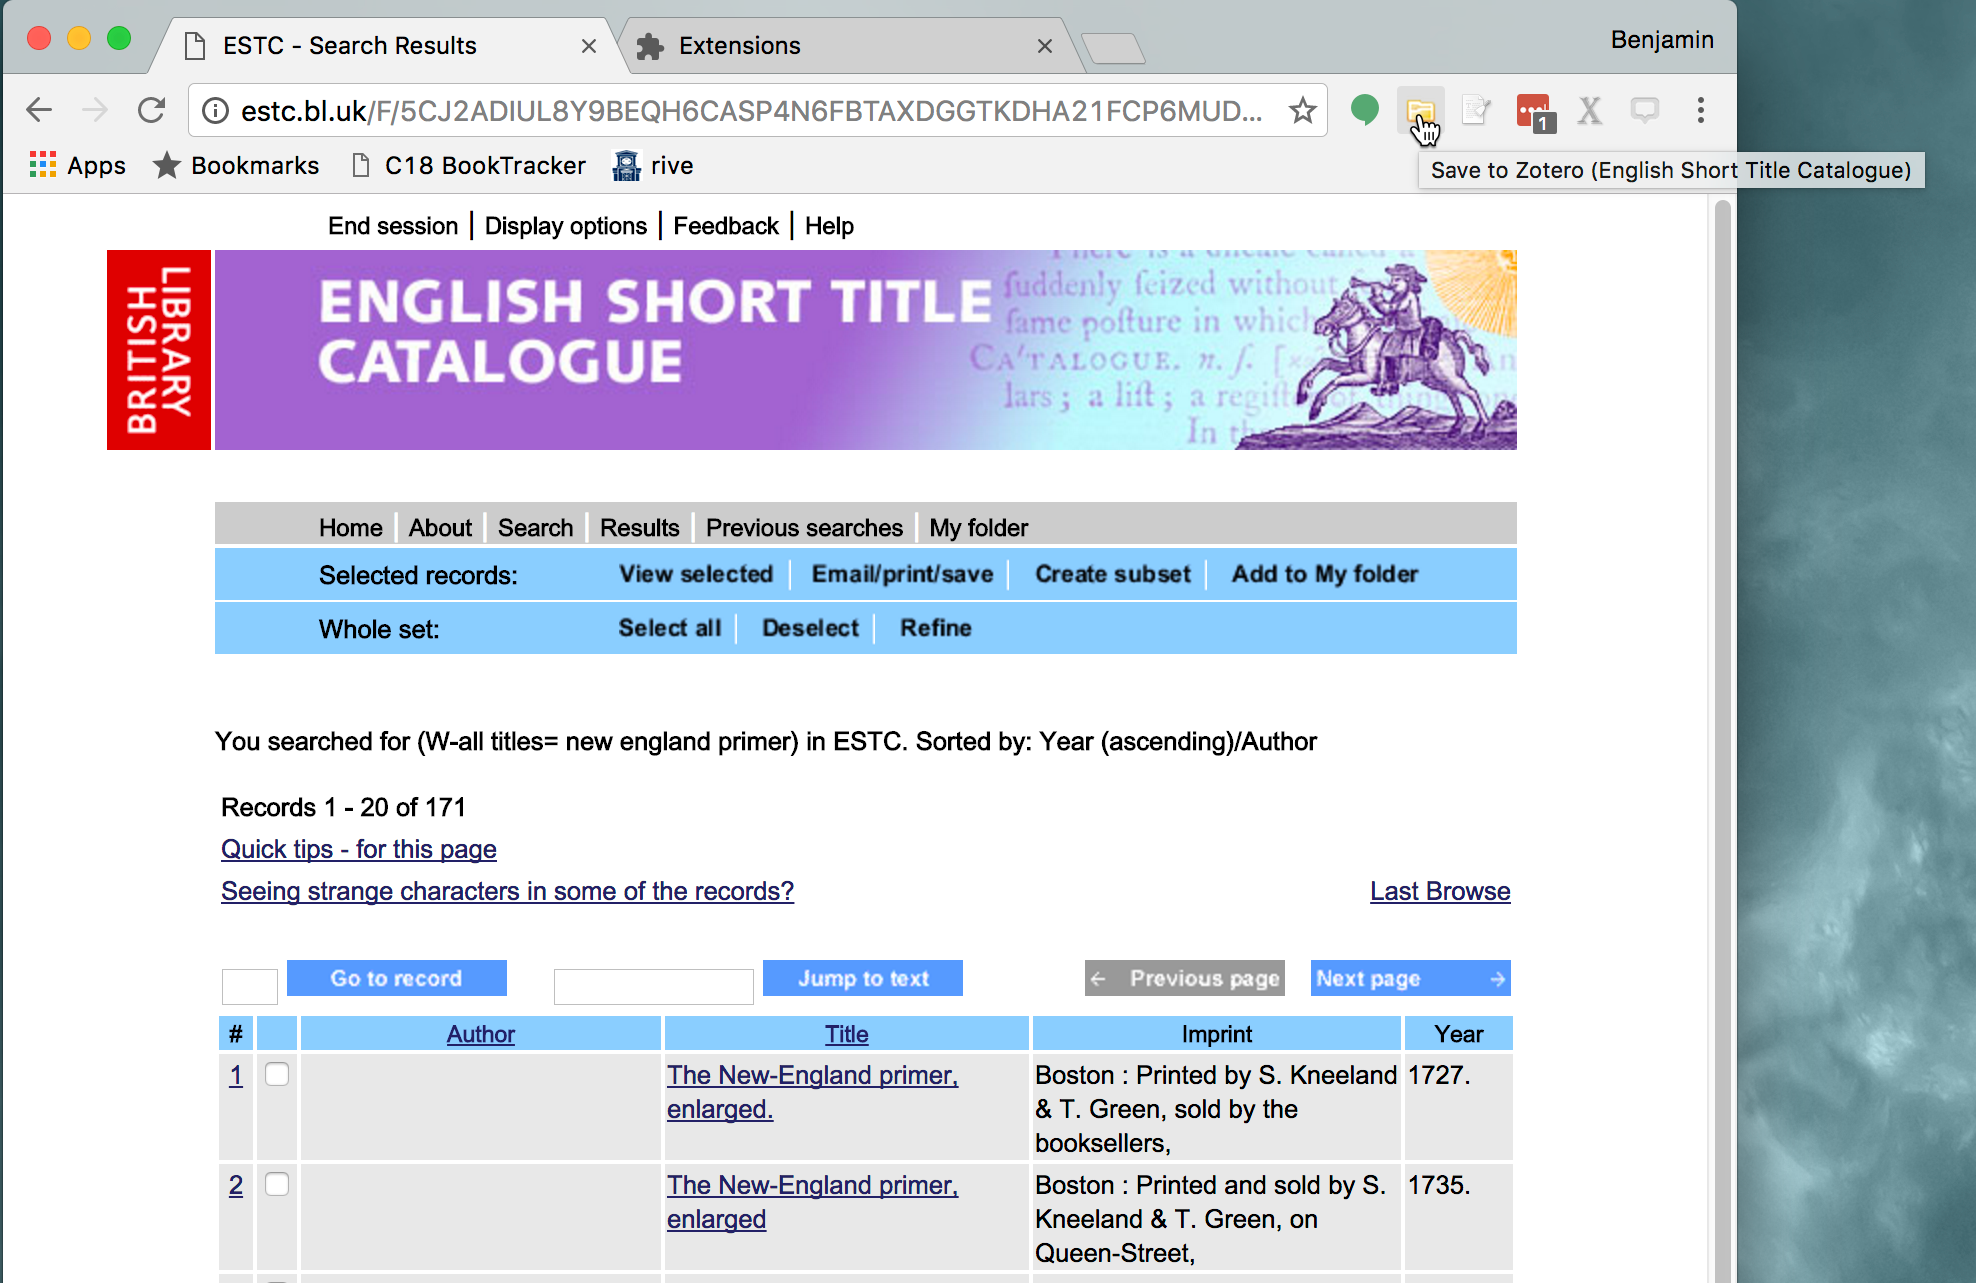
Once you get your results, look for the Zotero icon near your browser’s address bar; for a screen of multiple results, the icon will appear as a folder. (All screenshots are from Chrome on a Mac). When you hover over this folder icon, if the English Short Title Catalogue translator is installed correctly, you’ll see this:
[If that translator isn’t installed correctly, you’ll see “Save to Zotero (Aleph),” instead. If you’re seeing that, stop and make sure that you put the translators in the proper folder (as described at the bottom of this page). If you know you’ve installed the translators where they’re supposed to go but you’re still not seeing “Save to Zotero (English Short Title Catalogue),” you may need to disable and re-enable the Zotero extension for your browser. In Chrome, right-click on the Zotero icon, select “Manage extensions,” then scroll down until you see Zotero, uncheck the box beside “Enabled” and then check it again. Go back to your ESTC results and refresh the page, then see if Zotero is recognizing the translator.]
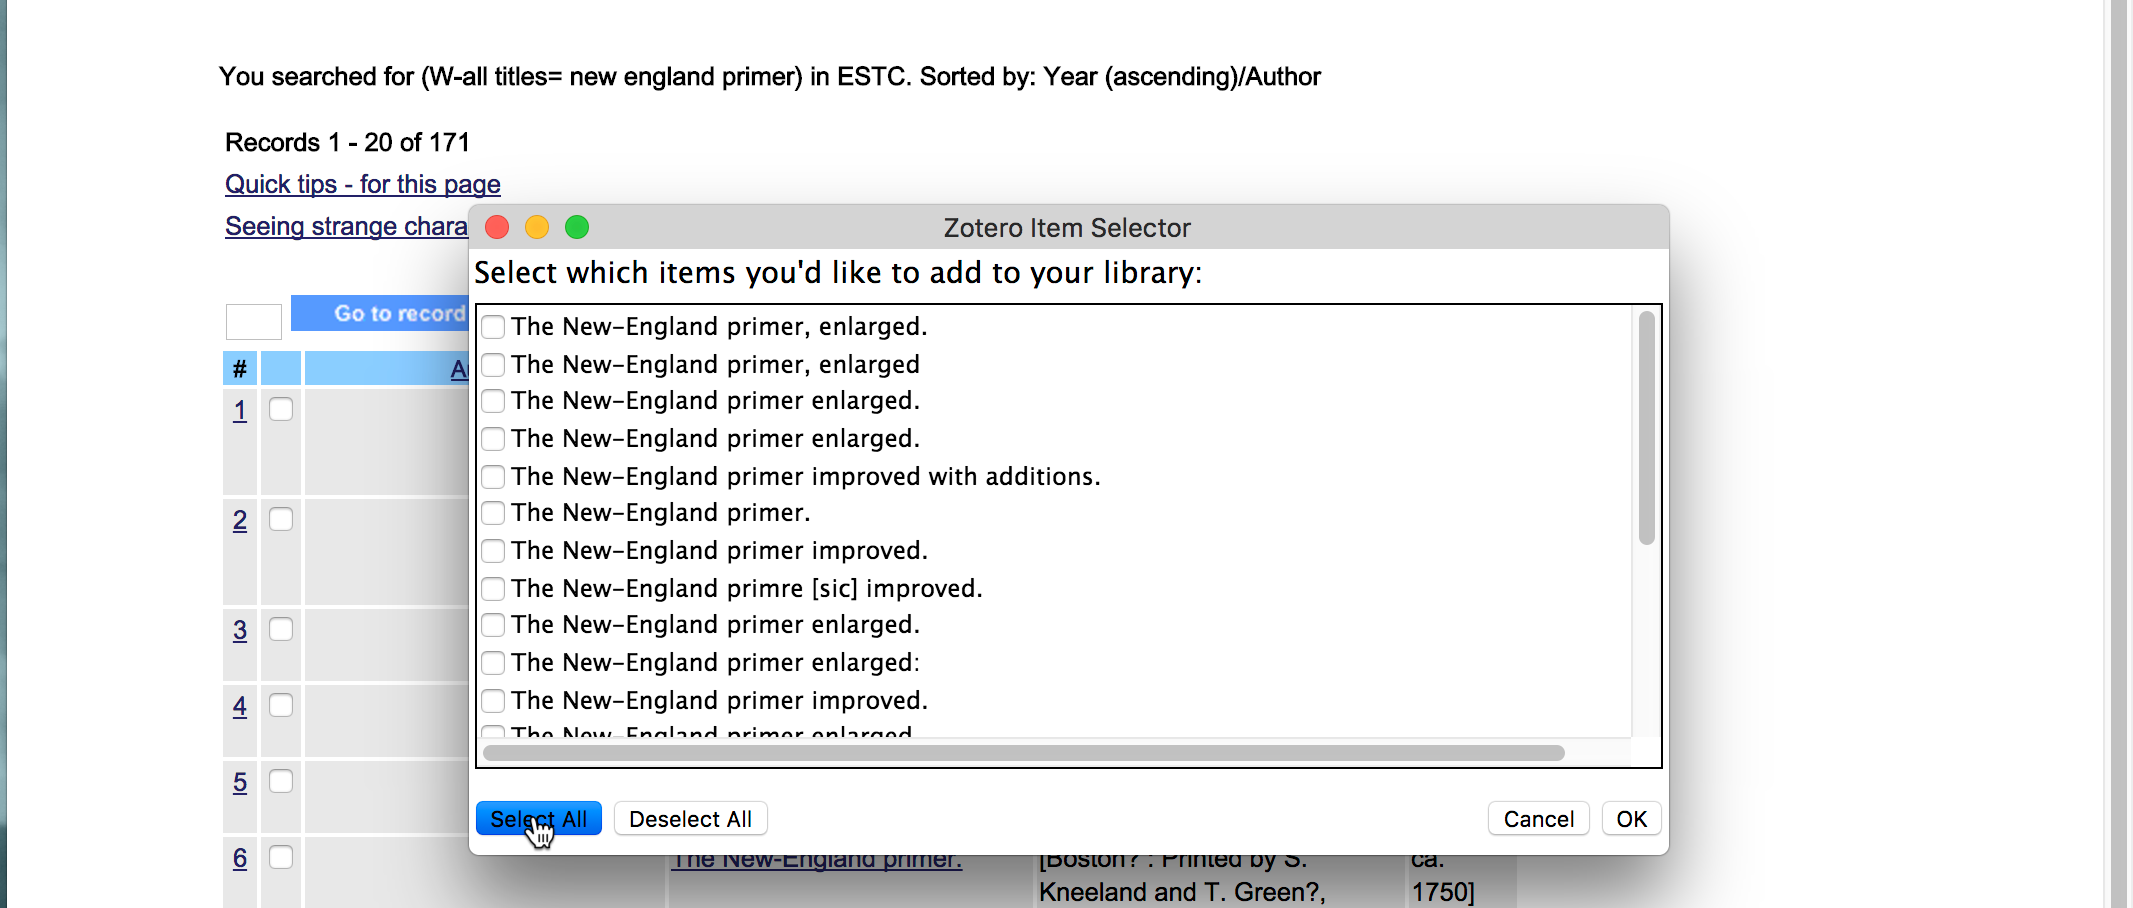
When you click on the Zotero icon, a pop-up window will appear allowing you to check the records you wish to add to Zotero. Either “Select all” or use the checkboxes next to the records you want, then click “OK.” You’ll see a small progress pane as the records are added to Zotero. Repeat for the rest of the records you want to gather.
Step 2: Exporting a .csv file of ESTC data from Zotero
We’re going to leave Chrome for a minute and switch to Zotero. In Zotero, highlight all the records you just imported, then right-click and select “Export Items…”
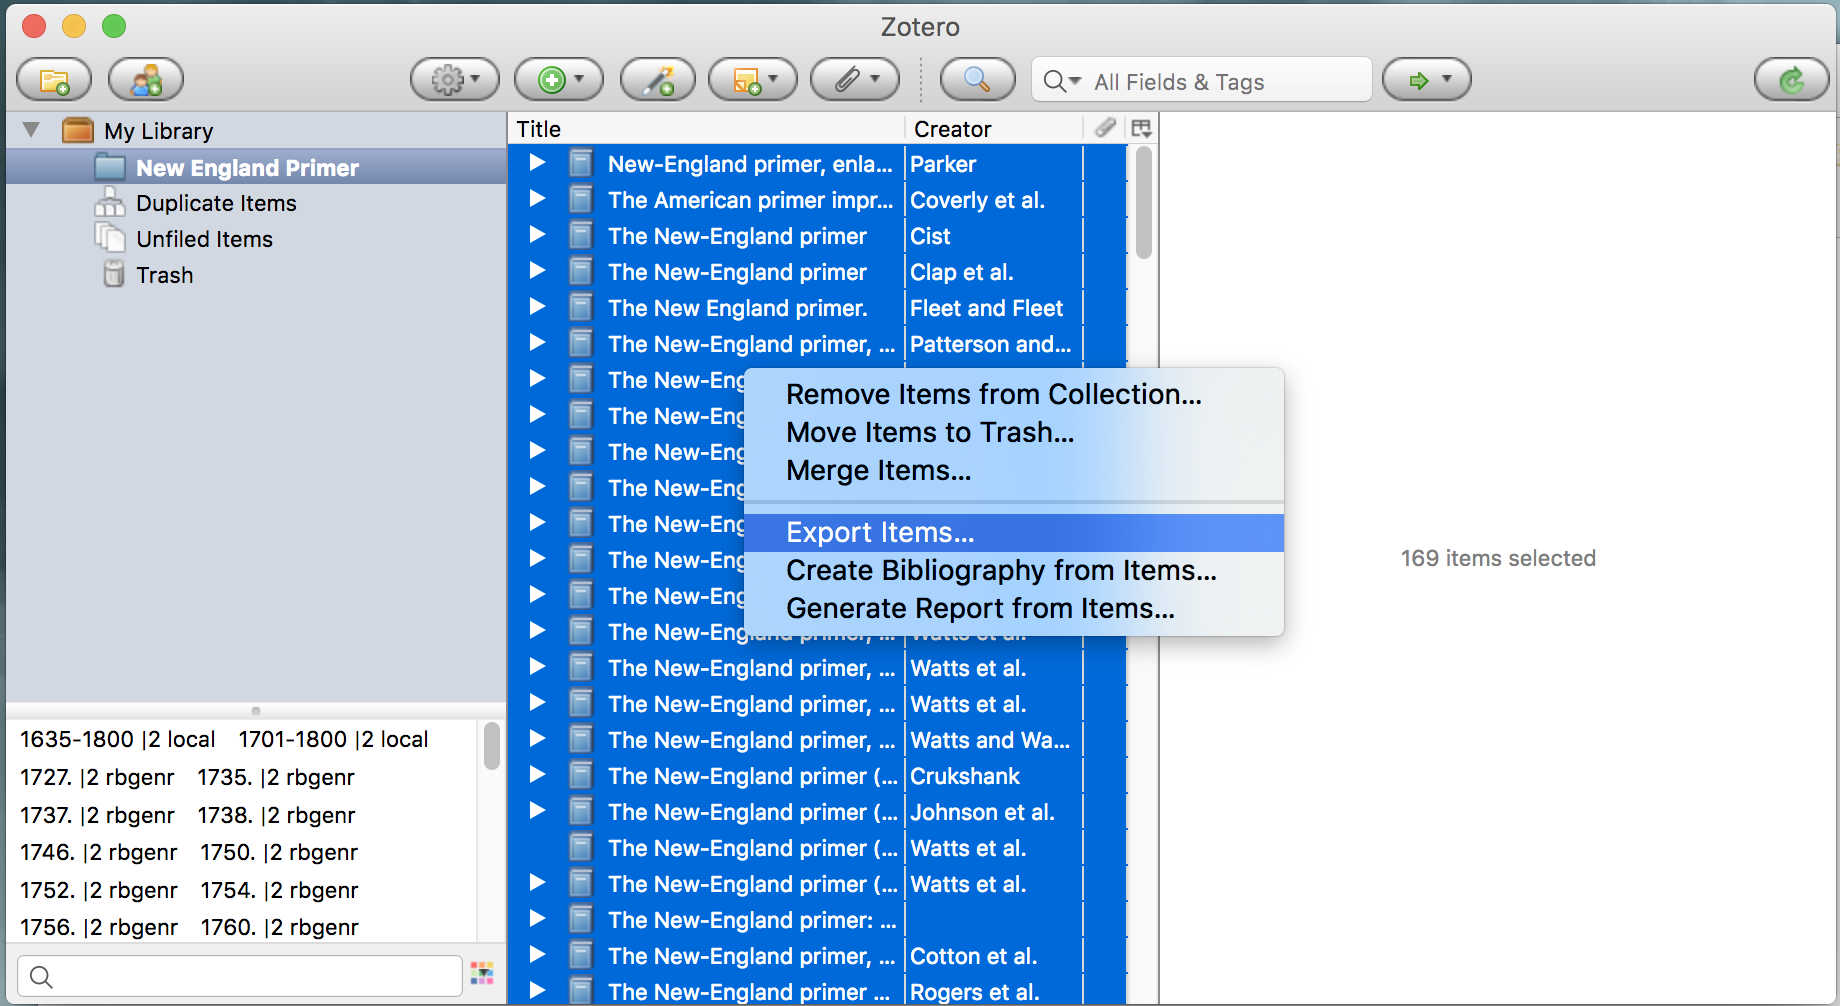
If your ESTC translators are installed properly (and they should be by now), you’ll see an option for “ESTC-CSV.” Select that, click “OK” and save the resulting .csv file somewhere you can find it easily.
Step 3: Importing the .csv file into Open Refine for data cleaning
Your .csv file of ESTC information includes a column for the place of publication, but the form of the publication city in the record may not be consistent from record to record. (Some will begin with square brackets if the place of publication was inferred by a cataloger, for instance. Sometimes a state will be supplied for a North American city, and other times it won’t, and so on.) We’re going to use Open Refine to regularize the forms of those publication places so we can geocode them.
Go ahead and launch Open Refine. It will open a new tab in your default web browser. If you want to work with Open Refine in a different browser, just enter 127.0.0.1:3333 in the browser’s address bar to bring up the Open Refine window.
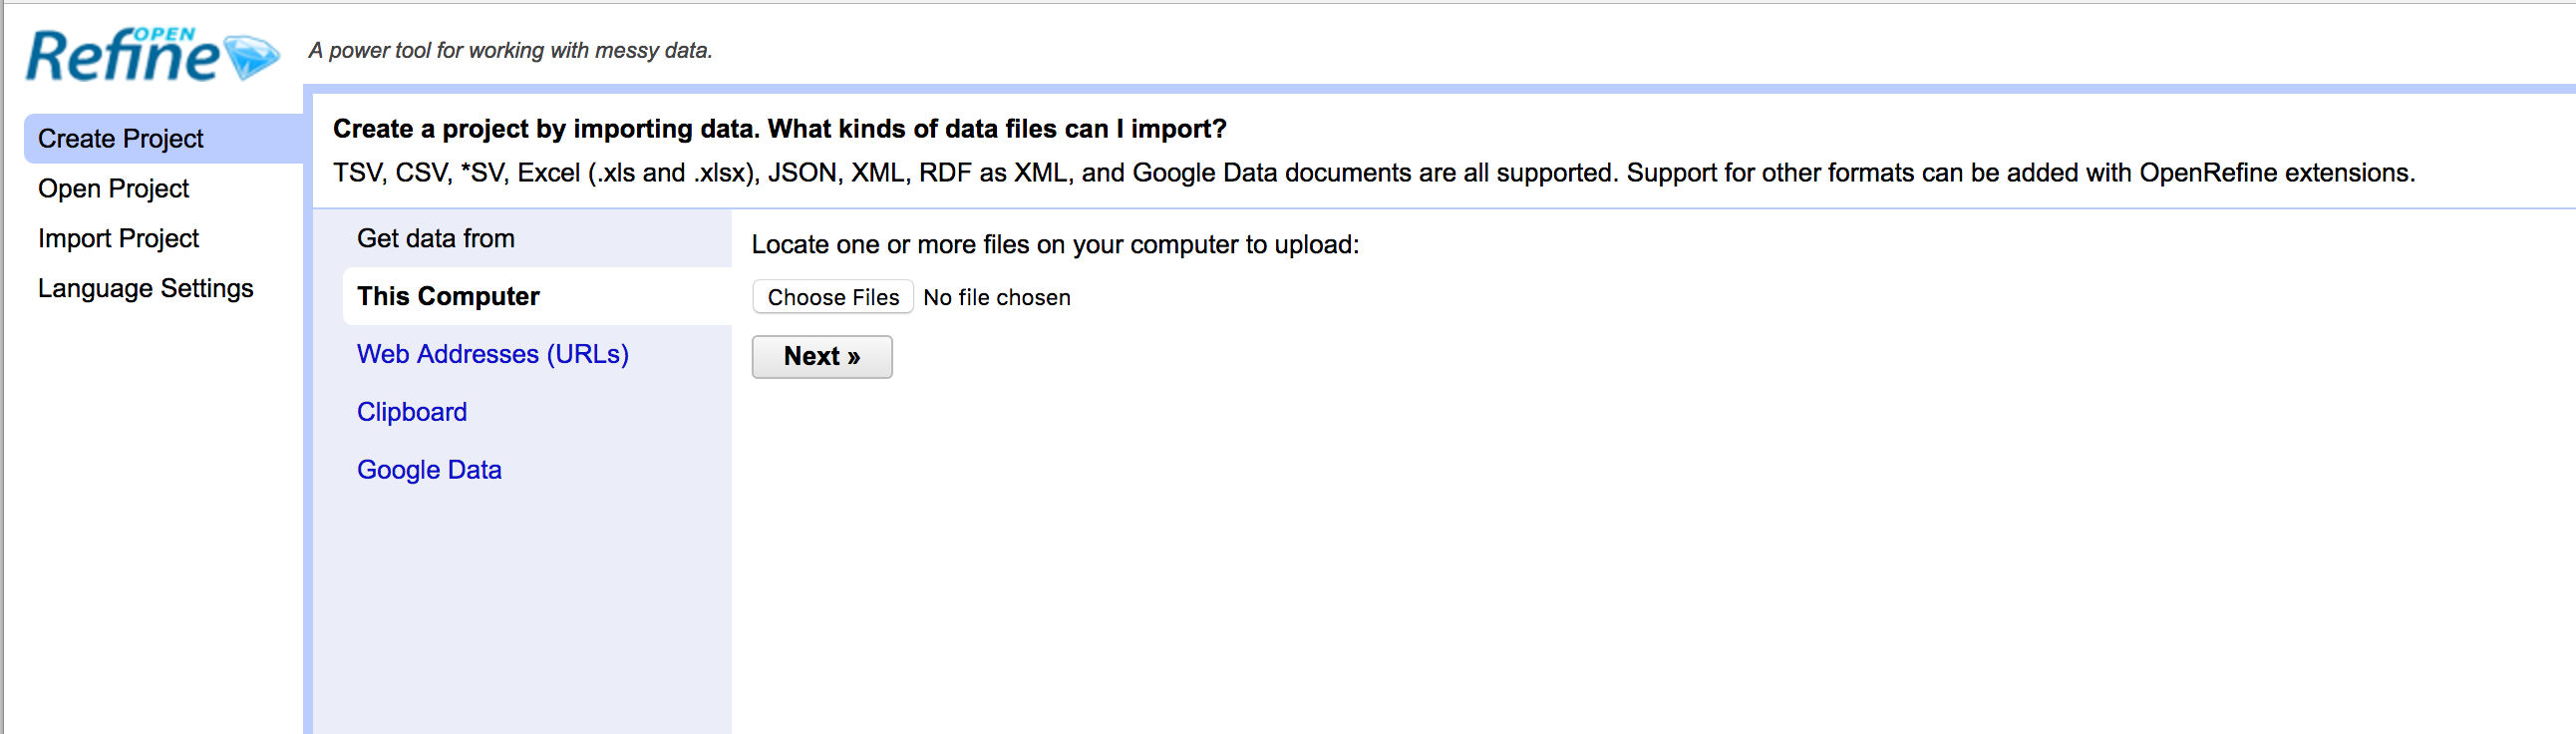
Select “Create Project,” upload the .csv file you downloaded in the previous step, and click “Next.” Open Refine will present you with a preview of your data:
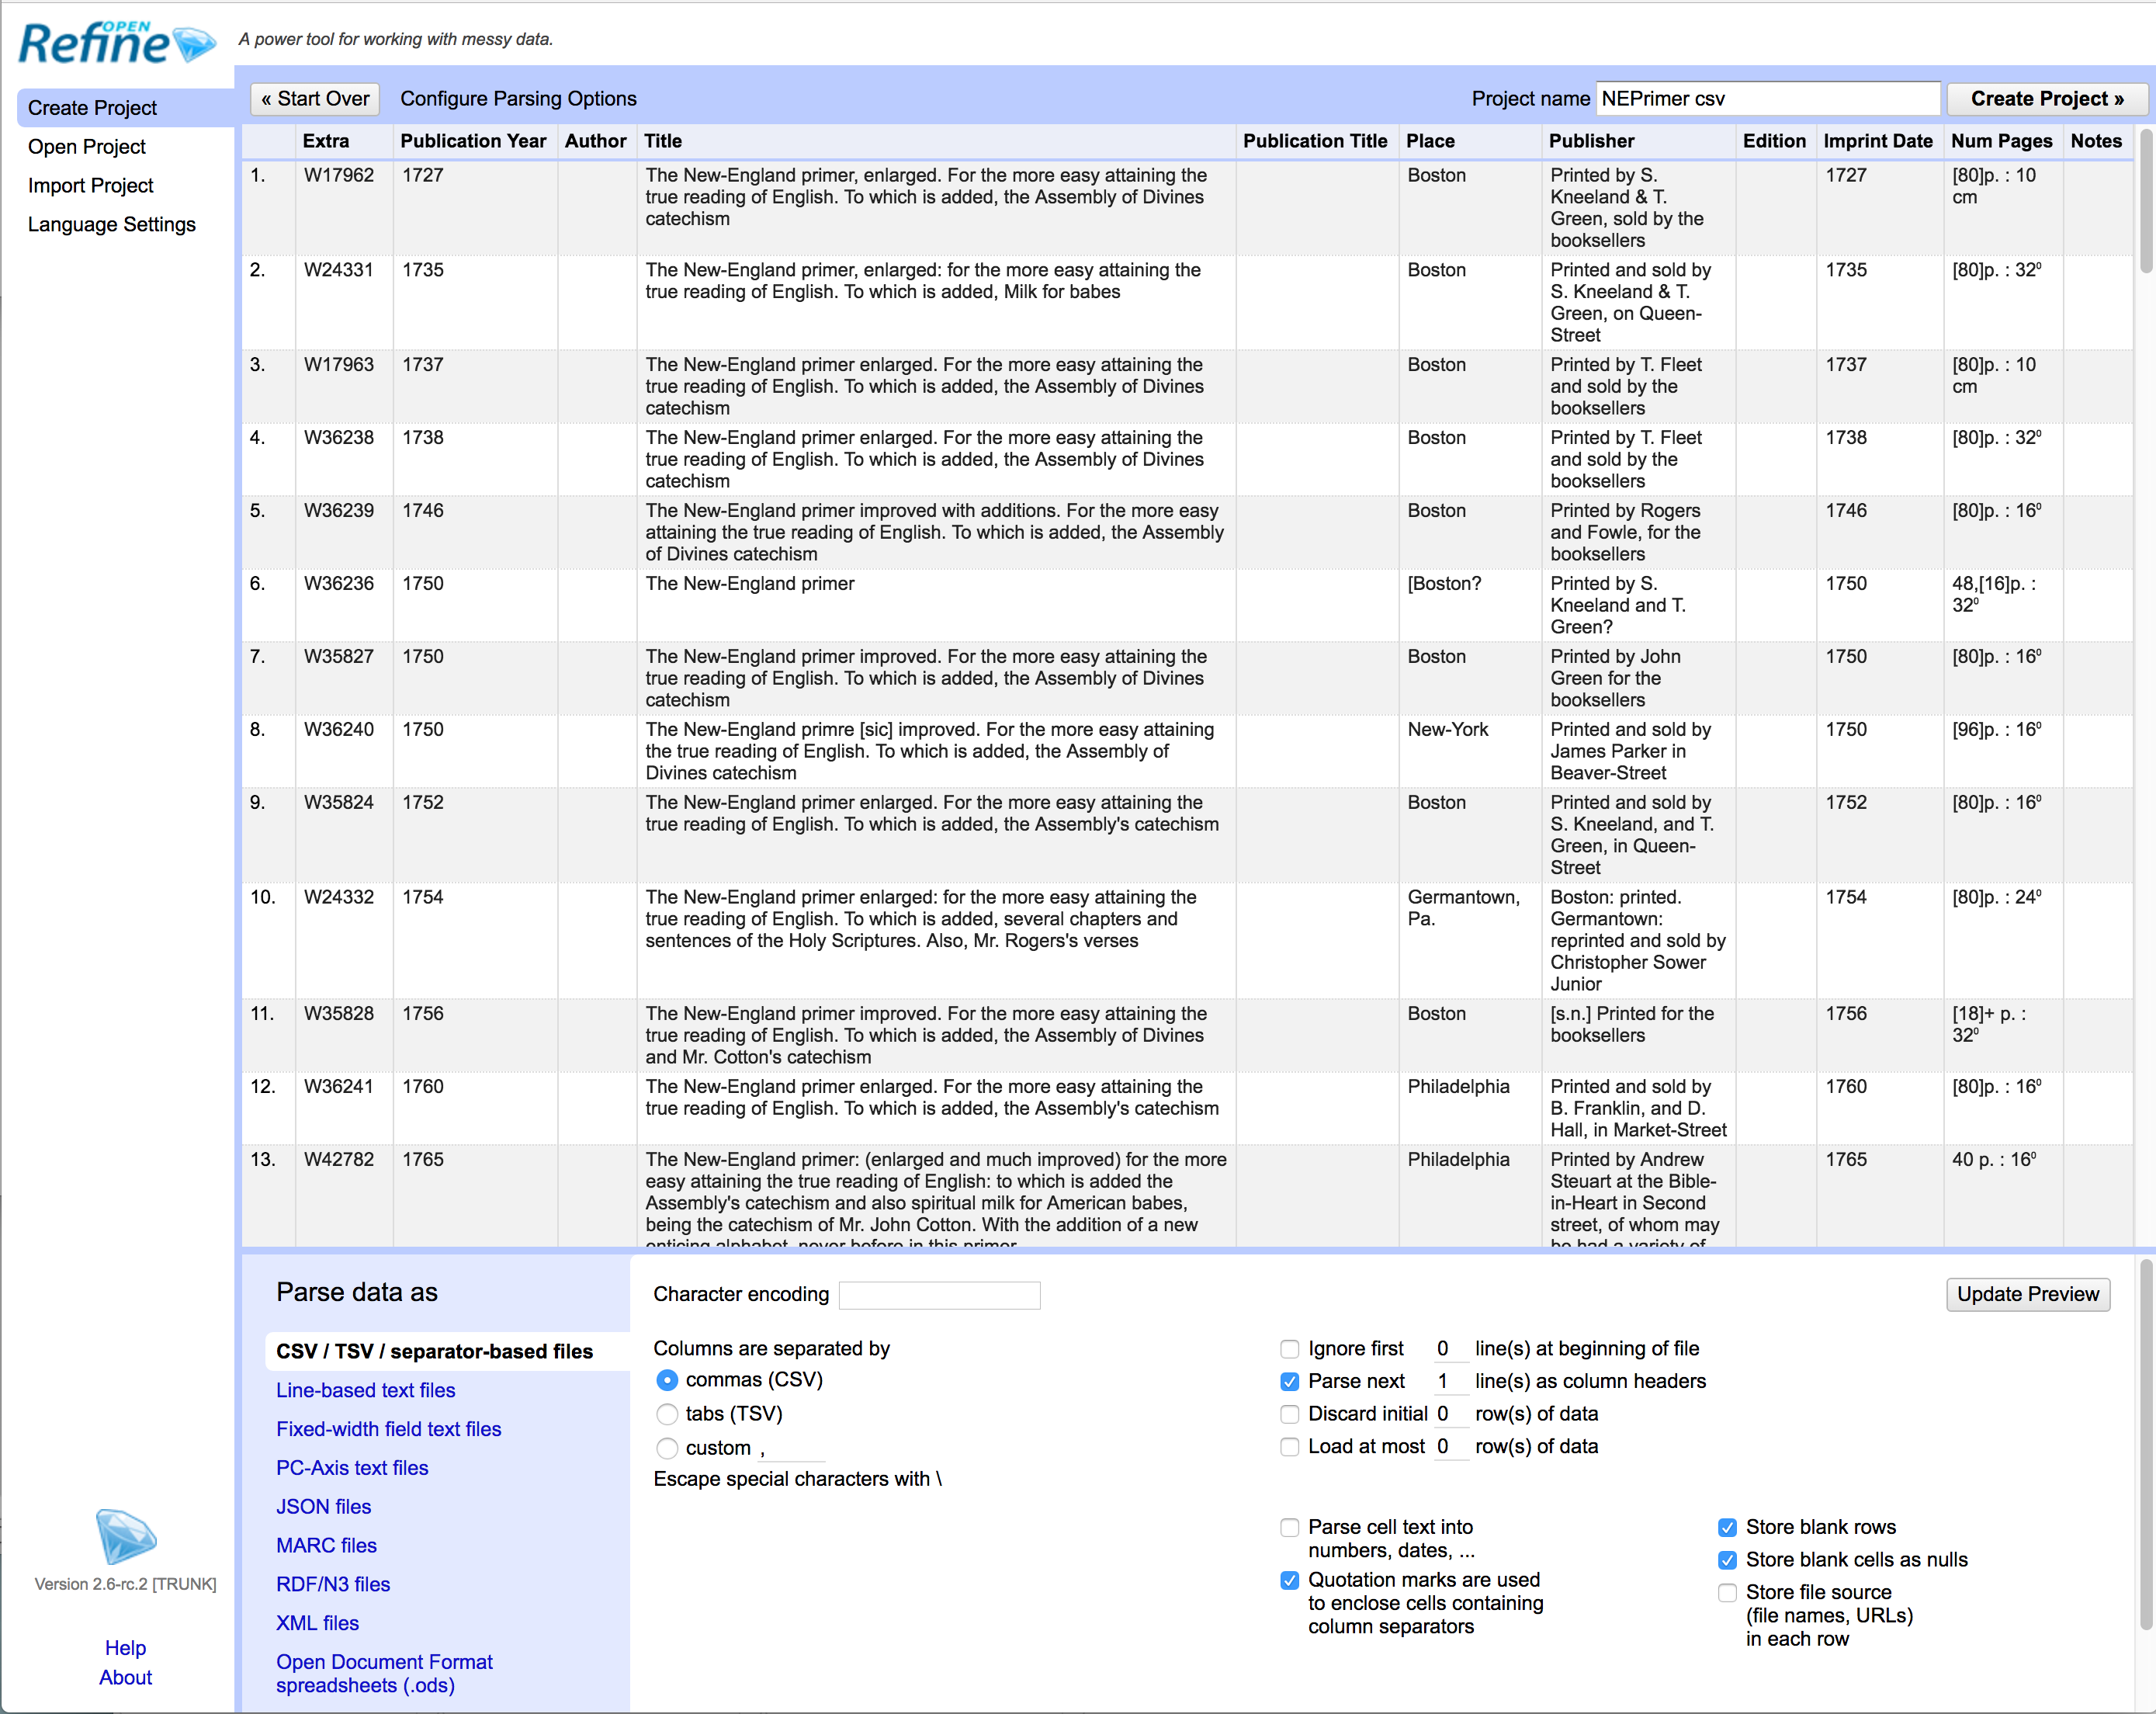
(Note: The .csv you’ve gotten from Zotero should work without incident, but notice that the pane at the bottom gives you some options for adjusting the way that your data is imported—you can work with these options to bring data into Open Refine even if it isn’t perfectly formed.) When you’re satisfied that your columns look the way they should, click “Create Project” at the upper right.
Step 4: Cleaning data in Open Refine
At this point, what we need to do is to regularize the place names in the “Place” column. Rather than just editing those values directly, I’d recommend making a copy of that column so we can leave the original data as is (that way, if we screw anything up, we haven’t lost what was there originally).
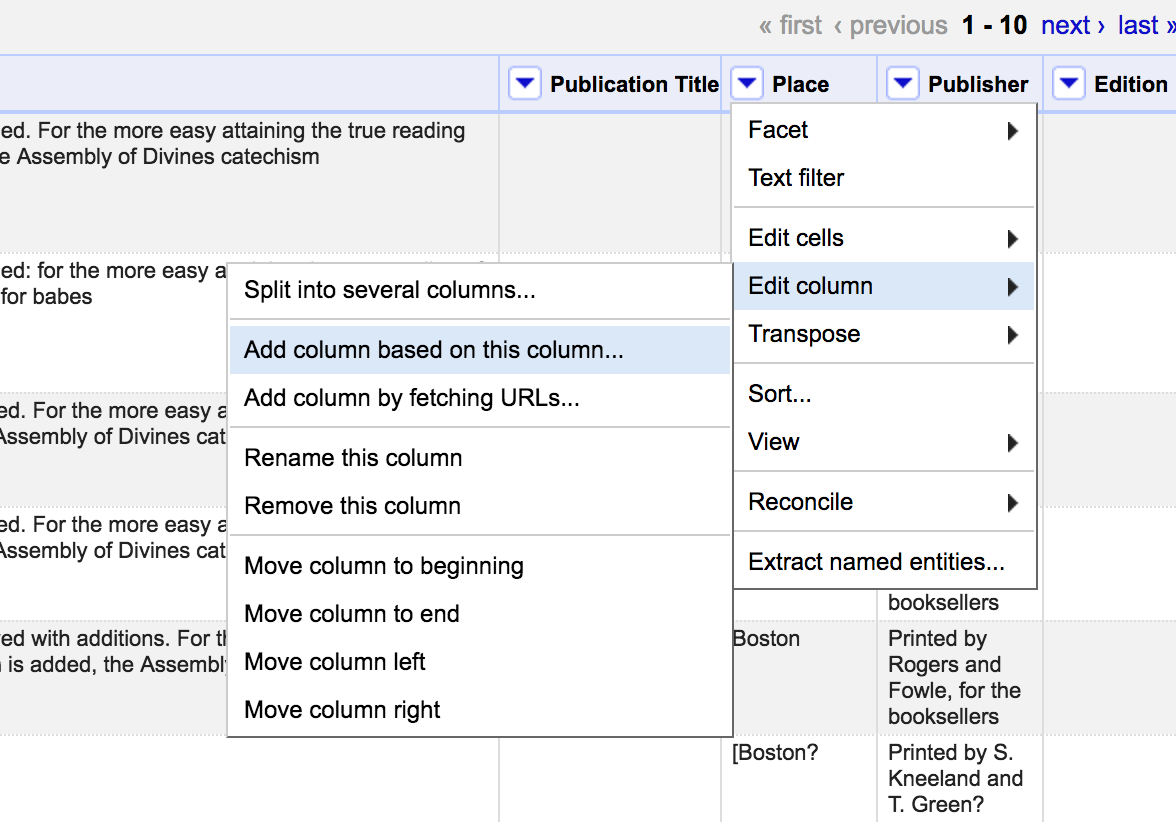
Click on the small triangle at the top of the “Place” column, select “Edit column” and then select “Add column based on this column…”
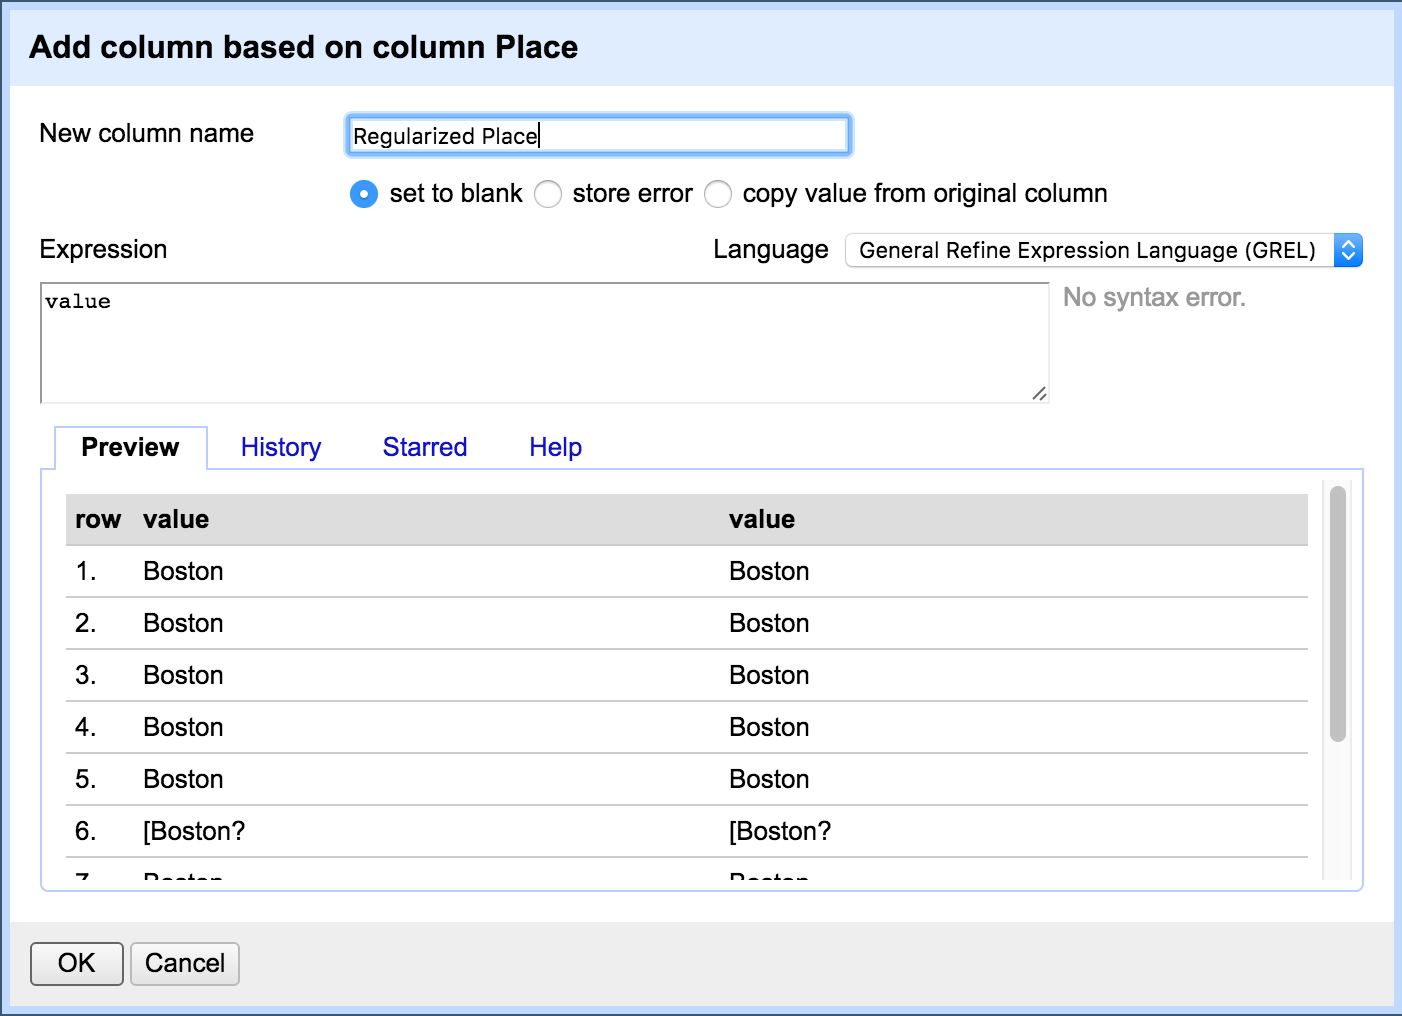
For now, we just want to duplicate the Place column, so give our new column a name (I’m using “Regularized Place”) and click “OK.”
At this point, we’re going to start editing cells in our new column in bulk: we want to eliminate all of the slight variations in the forms of different place names. Open Refine offers a couple of ways to do this. First, let’s see how much of the work Open Refine can do for us.
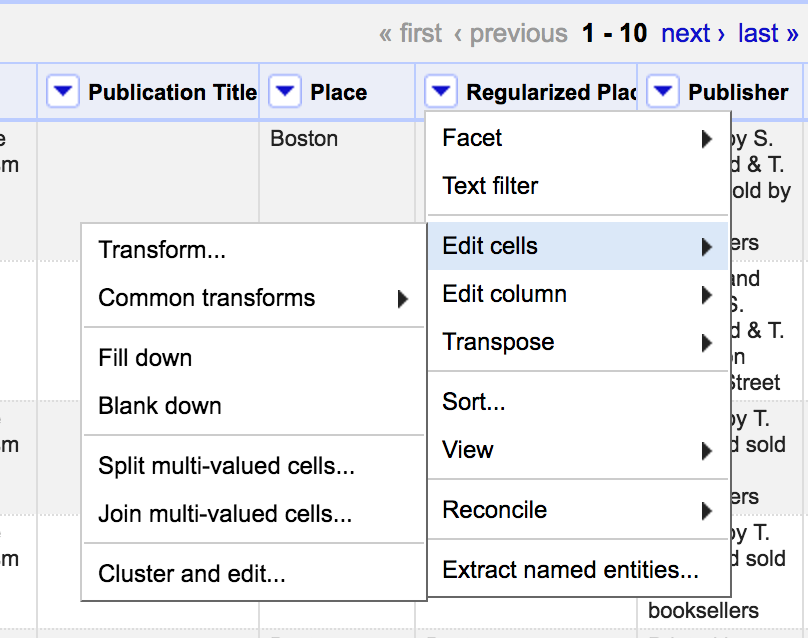
Click the triangle at the top of the new “Regularized Place” column, then select “Edit cells” and “Cluster and edit…”
Open Refine can use a number of different methods for identifying values that have a good chance of being different versions of the same thing. In this image, it’s offered three cases where it thinks different values could be merged together (e.g. 60 instances of “Boston” and three instances of “[Boston?”). I agree with its judgment, so I’ve checked the boxes and entered the value that I want to use as a replacement (every instance of “Boston” as well as every instance of “[Boston?” will now become “Boston MA”).
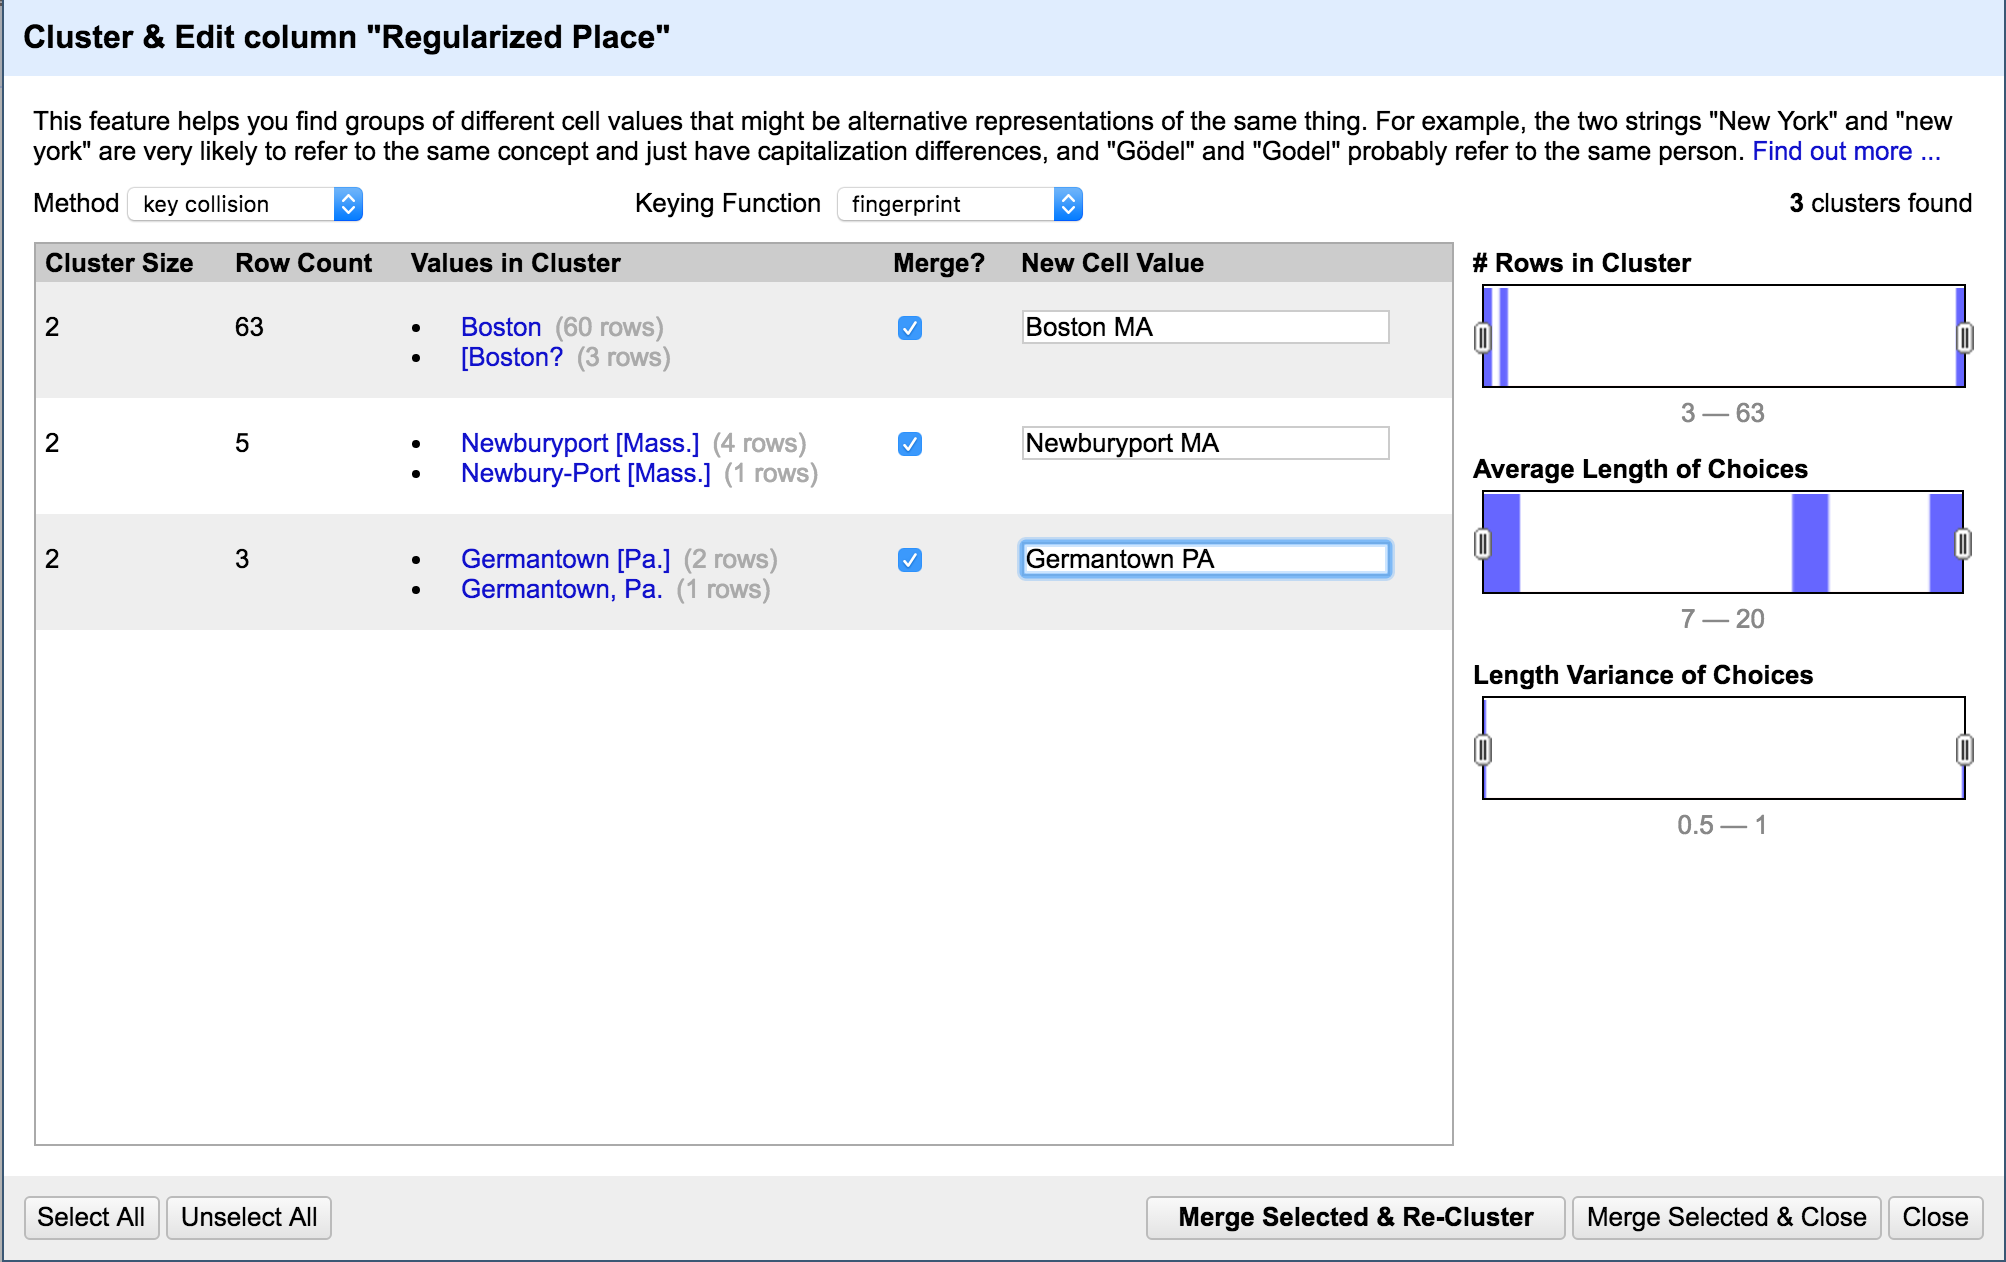
Click “Merge Selected & Re-Cluster.” Open Refine will report that it can’t find any more clusters using the selected method. Now, I’m going to be perfectly honest with you and say that, since I have absolutely no understanding of the math behind any of this, anyway, I just worked my way through the different options and found that several of them turned up new clusters. The Open Refine wiki offers an in-depth discussion of clustering if you want to know more. Or you could just play “What does this knob do?”
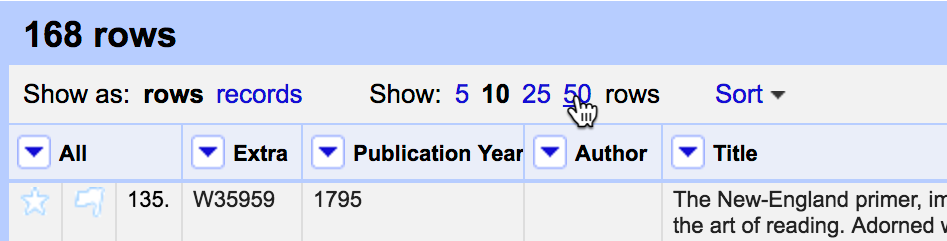
After a while, you will have exhausted the ability of “Cluster and edit” to fix things for you automatically. At this point, we start having to do a little bit more by hand. Click the triangle at the top of the “Regularized Place” column and then sort by that column. (At this point, it would probably be a good idea to increase the number of rows that Open Refine displays from ten to 50.)
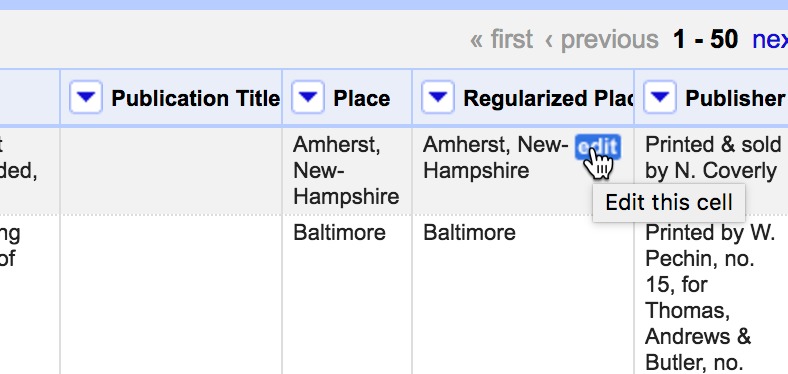
To edit a cell in Open Refine, hover over the cell and click the “edit” button that appears:
Edit the value and then click “Apply” (or hit enter). If you see that the same value appears in multiple rows (this will be easy to see if you sort by the “Regularized Place” column first), you can change the value and click “Apply to All Identical Cells” (or hit control-enter).
Now you just have to work your way through the rows of your spreadsheet regularizing each of the various place names. This actually goes more quickly than you would think.
A few notes:
- Every time you “Apply to All Identical Cells,” Open Refine will take you back to the first page of your workbook, so you’ll have to click forward to get back to where you left off.
- In my examples, I’ve been dealing with US cities, so I’ve given an abbreviation for the state. For non-US cities, it can be a good idea to use a country code—UK for England or Scotland, IE for Ireland, FR for France, etc. Here’s a list of country codes, if you need them.)
- You may run into some values that are un-mappable (I have some that just say “New-England” and “United States,” for instance). In that case, go to the beginning of the row and click on the star in the first column.
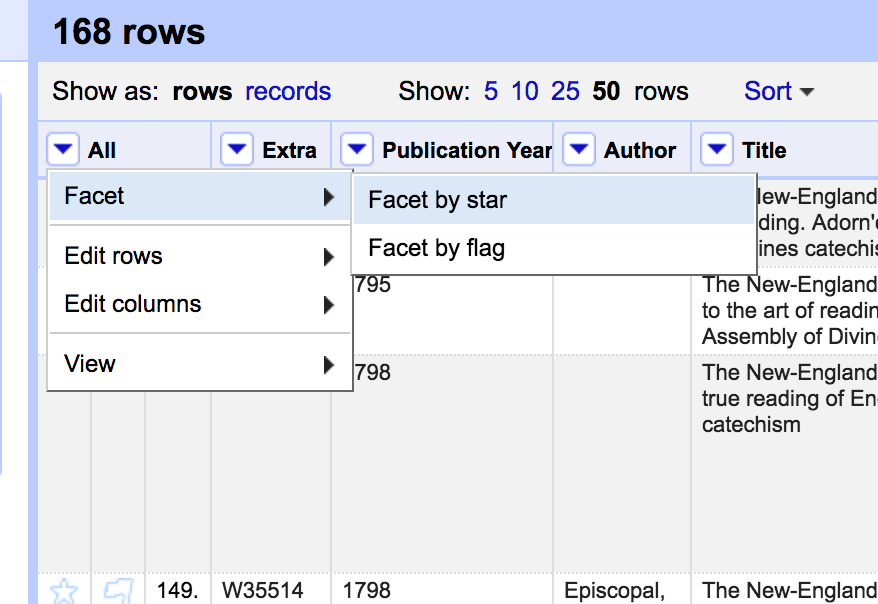
When you’ve made it through your rows, if you had to star any un-mappable places, click on the small triangle at the top of the column with the stars and select “Facet,” then “Facet by star”:
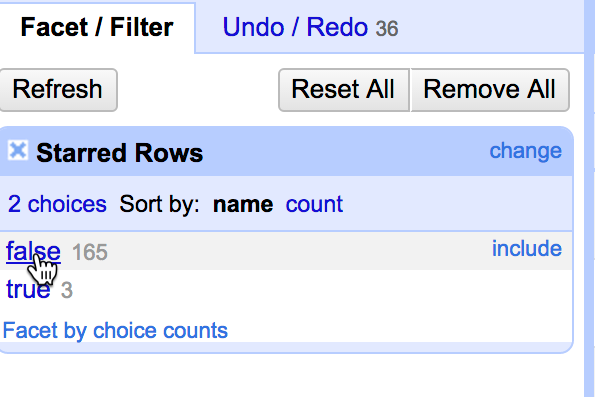
You’ll see a new box appear in the sidebar at left. Click “false” to include only the rows that aren’t starred (or, to put it another way, to exclude the rows that you starred because they were unmappable).
Interlude: Two roads diverged in a mapping assignment, and I— / I sort of had to make a decision about just which trade-offs I wanted to make
At this point, we actually have everything we’d need to put these records on a map using Google’s Fusion Tables tool: click “Export” at the top right, download a .csv file, upload that puppy to Fusion Tables and the end is very much in sight. Dr. Bankhurst has put together a tutorial on Fusion Tables that will show you how that works.
There are some very appealing reasons to use Fusion Tables at this point:
- Fusion Tables makes it easy to share your data with other people so they can re-use it;
- Fusion tables will handle the geocoding of place names for you using Google Maps Geocoding API;
- Maps created by Fusion Tables are shareable via iframe (which I had not realized—my mistake), which means you can embed them in your blog posts;
- Fusion tables allows you to apply value filters to your maps—so you could see a map, for example, including only cities in which a book was published in a certain range of years.
BUT. But, but, but. (You knew there was a “but,” right?) Fusion Tables has a kind of jaw-dropping limitation that Google has made it clear they don’t consider it a priority to fix: when you click on a map point in a Fusion Tables map, it will pop up an information box that includes information for one and only one row in your Fusion Table. So if you have 66 records for Boston (as I do in my New England Primer example), you’ll only get the first one.
Setting up a map in Fusion Tables could still be a good idea for analyzing your records—I think you can gain good insights in spite of this limitation. But in what follows, I’m going to press on with a different method for using Google’s My Maps tool. It has different limitations of its own (if mapping is going to be important for your project, we should explore some more advanced options), but might be better suited for some purposes.
Step 5: Getting a list of unique cities and a count of the number of records for each city in Google Sheets
We’re going to leave Open Refine for this next step, but we’ll be back. (This step is going to be super fast.)
Click “Export” at the top right and download a .csv file that will include your now-regularized place names, then upload that .csv file to Google Drive and open it in Google Sheets.
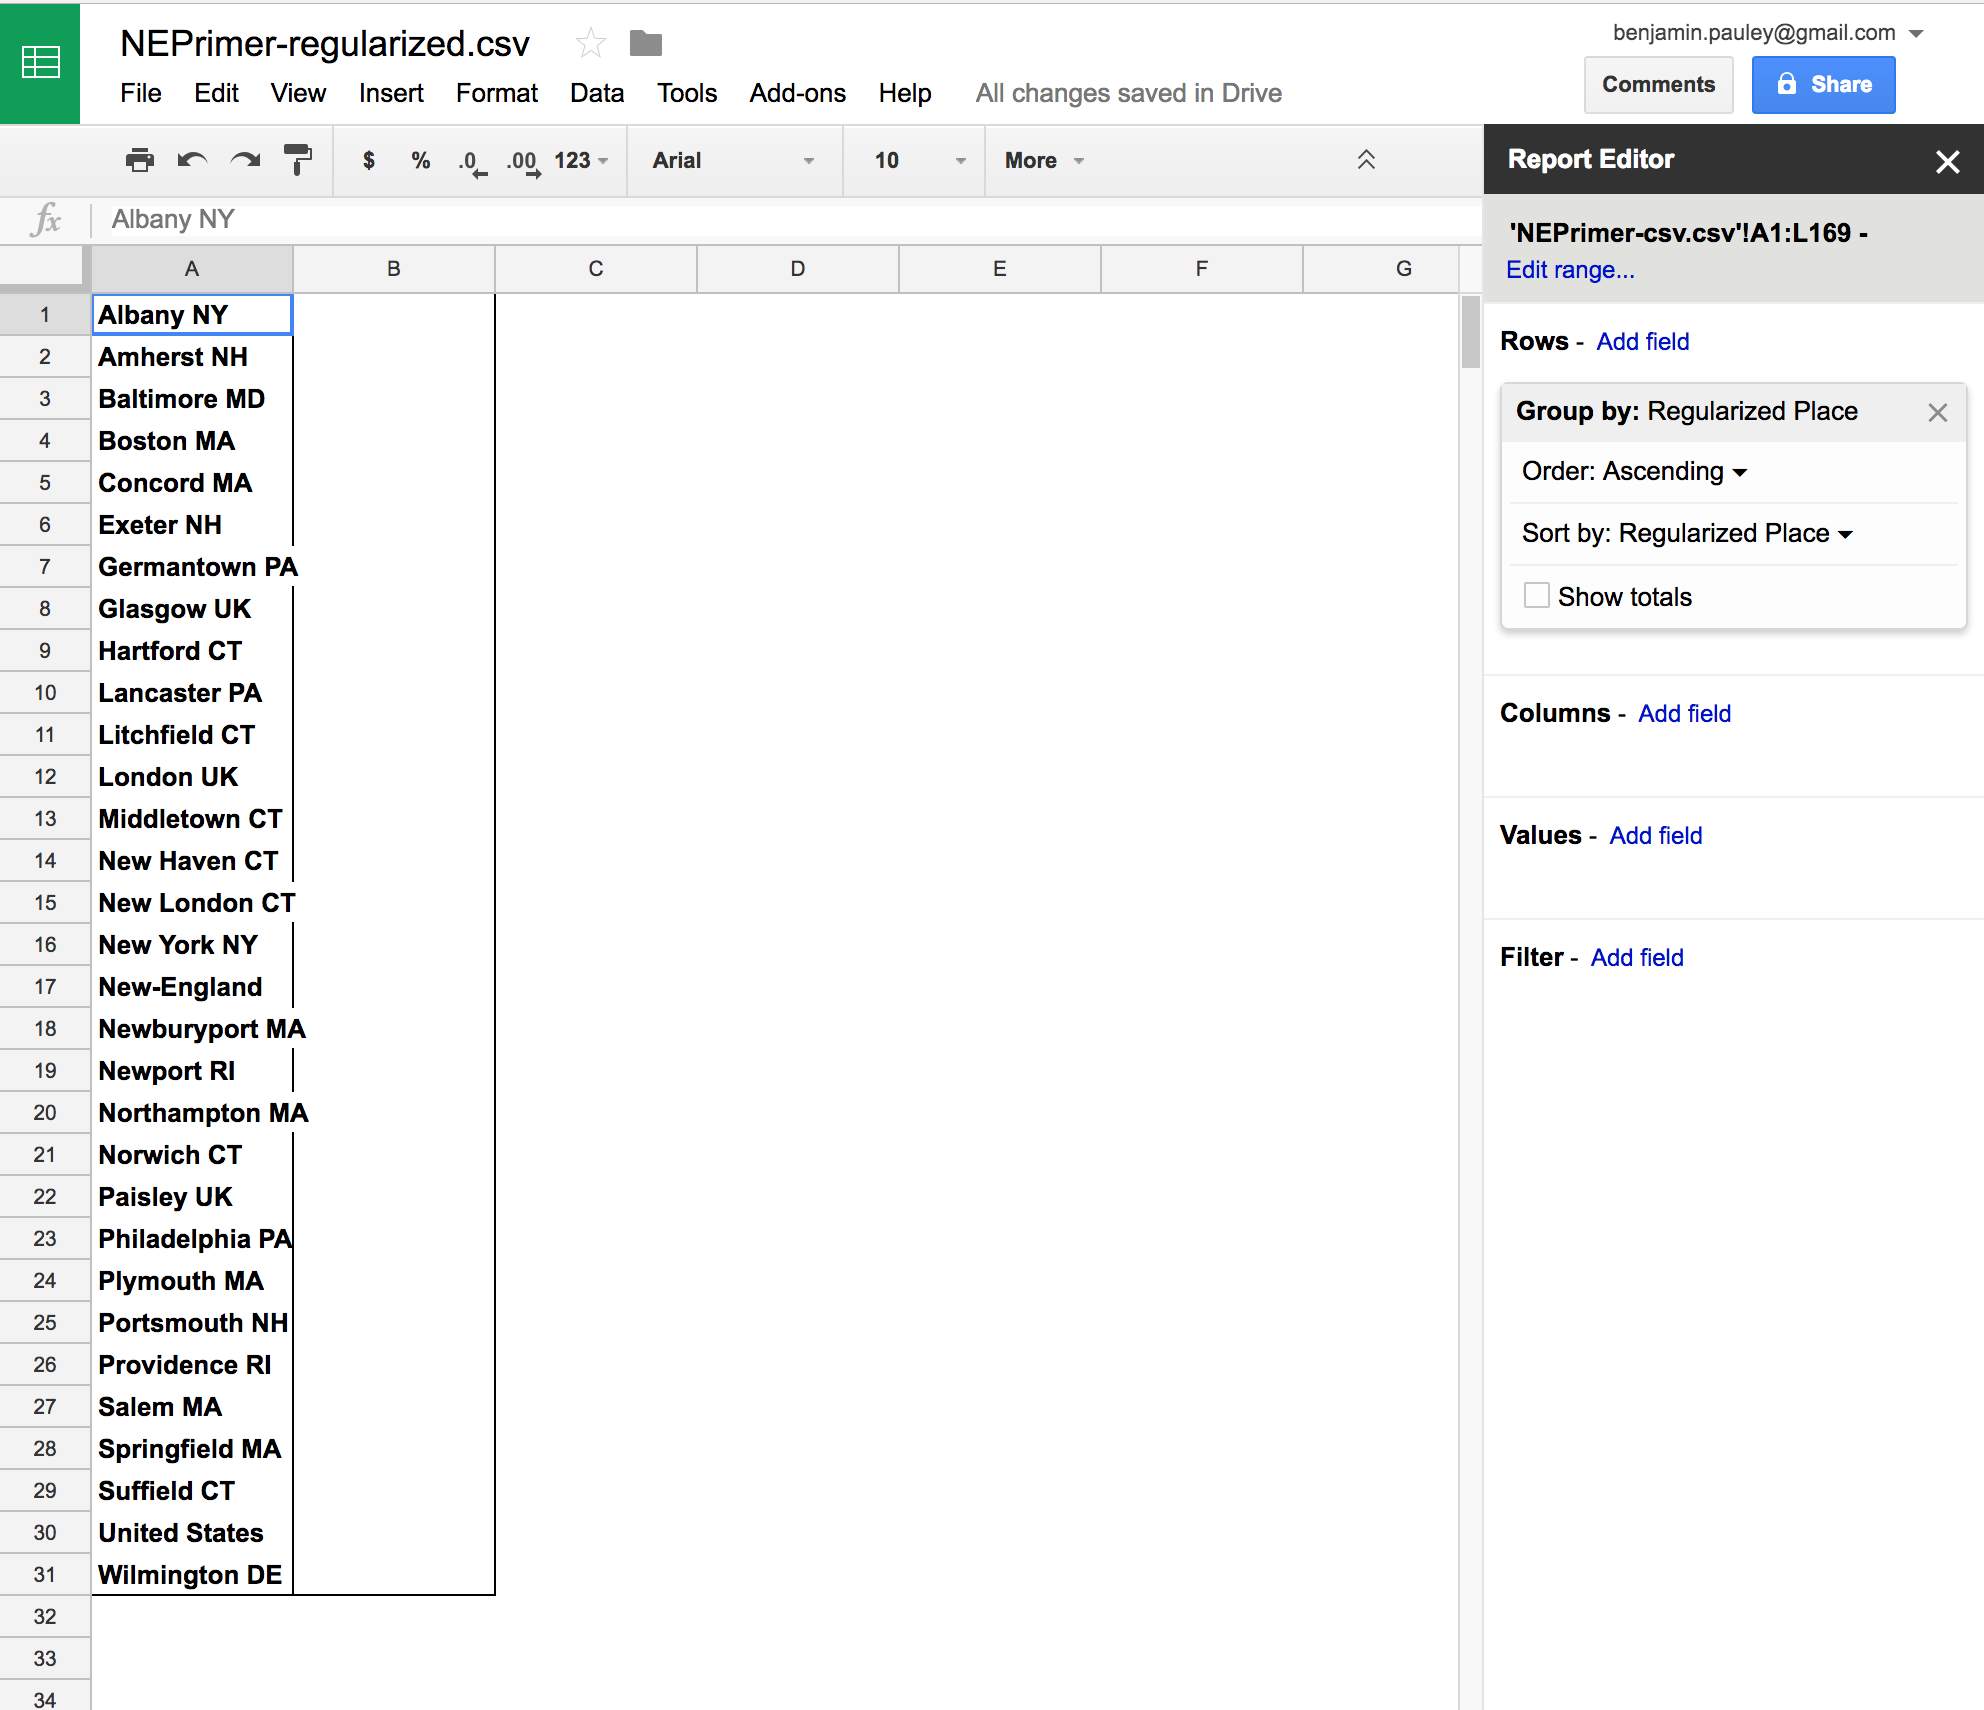
Once you’ve opened your file in Google Sheets, select “Data” then “Pivot table…”:

Sheets will create a new sheet in your workbook that will not look at all impressive at first.
![]()
Next to where it says “Rows” at right, click the link that says “Add field” and select the “Regularized Place” column (you can uncheck “Show totals because we won’t be needing that for what we’re doing):

Your pivot table will now have one row for each unique city in your list of records:
Now, next to “Values,” click “Add field,” select “Extra” and use the small triangle that will appear after “Summarize by: SUM” to change “SUM” to “COUNTA.” That will give us a count of the ESTC numbers for each city:
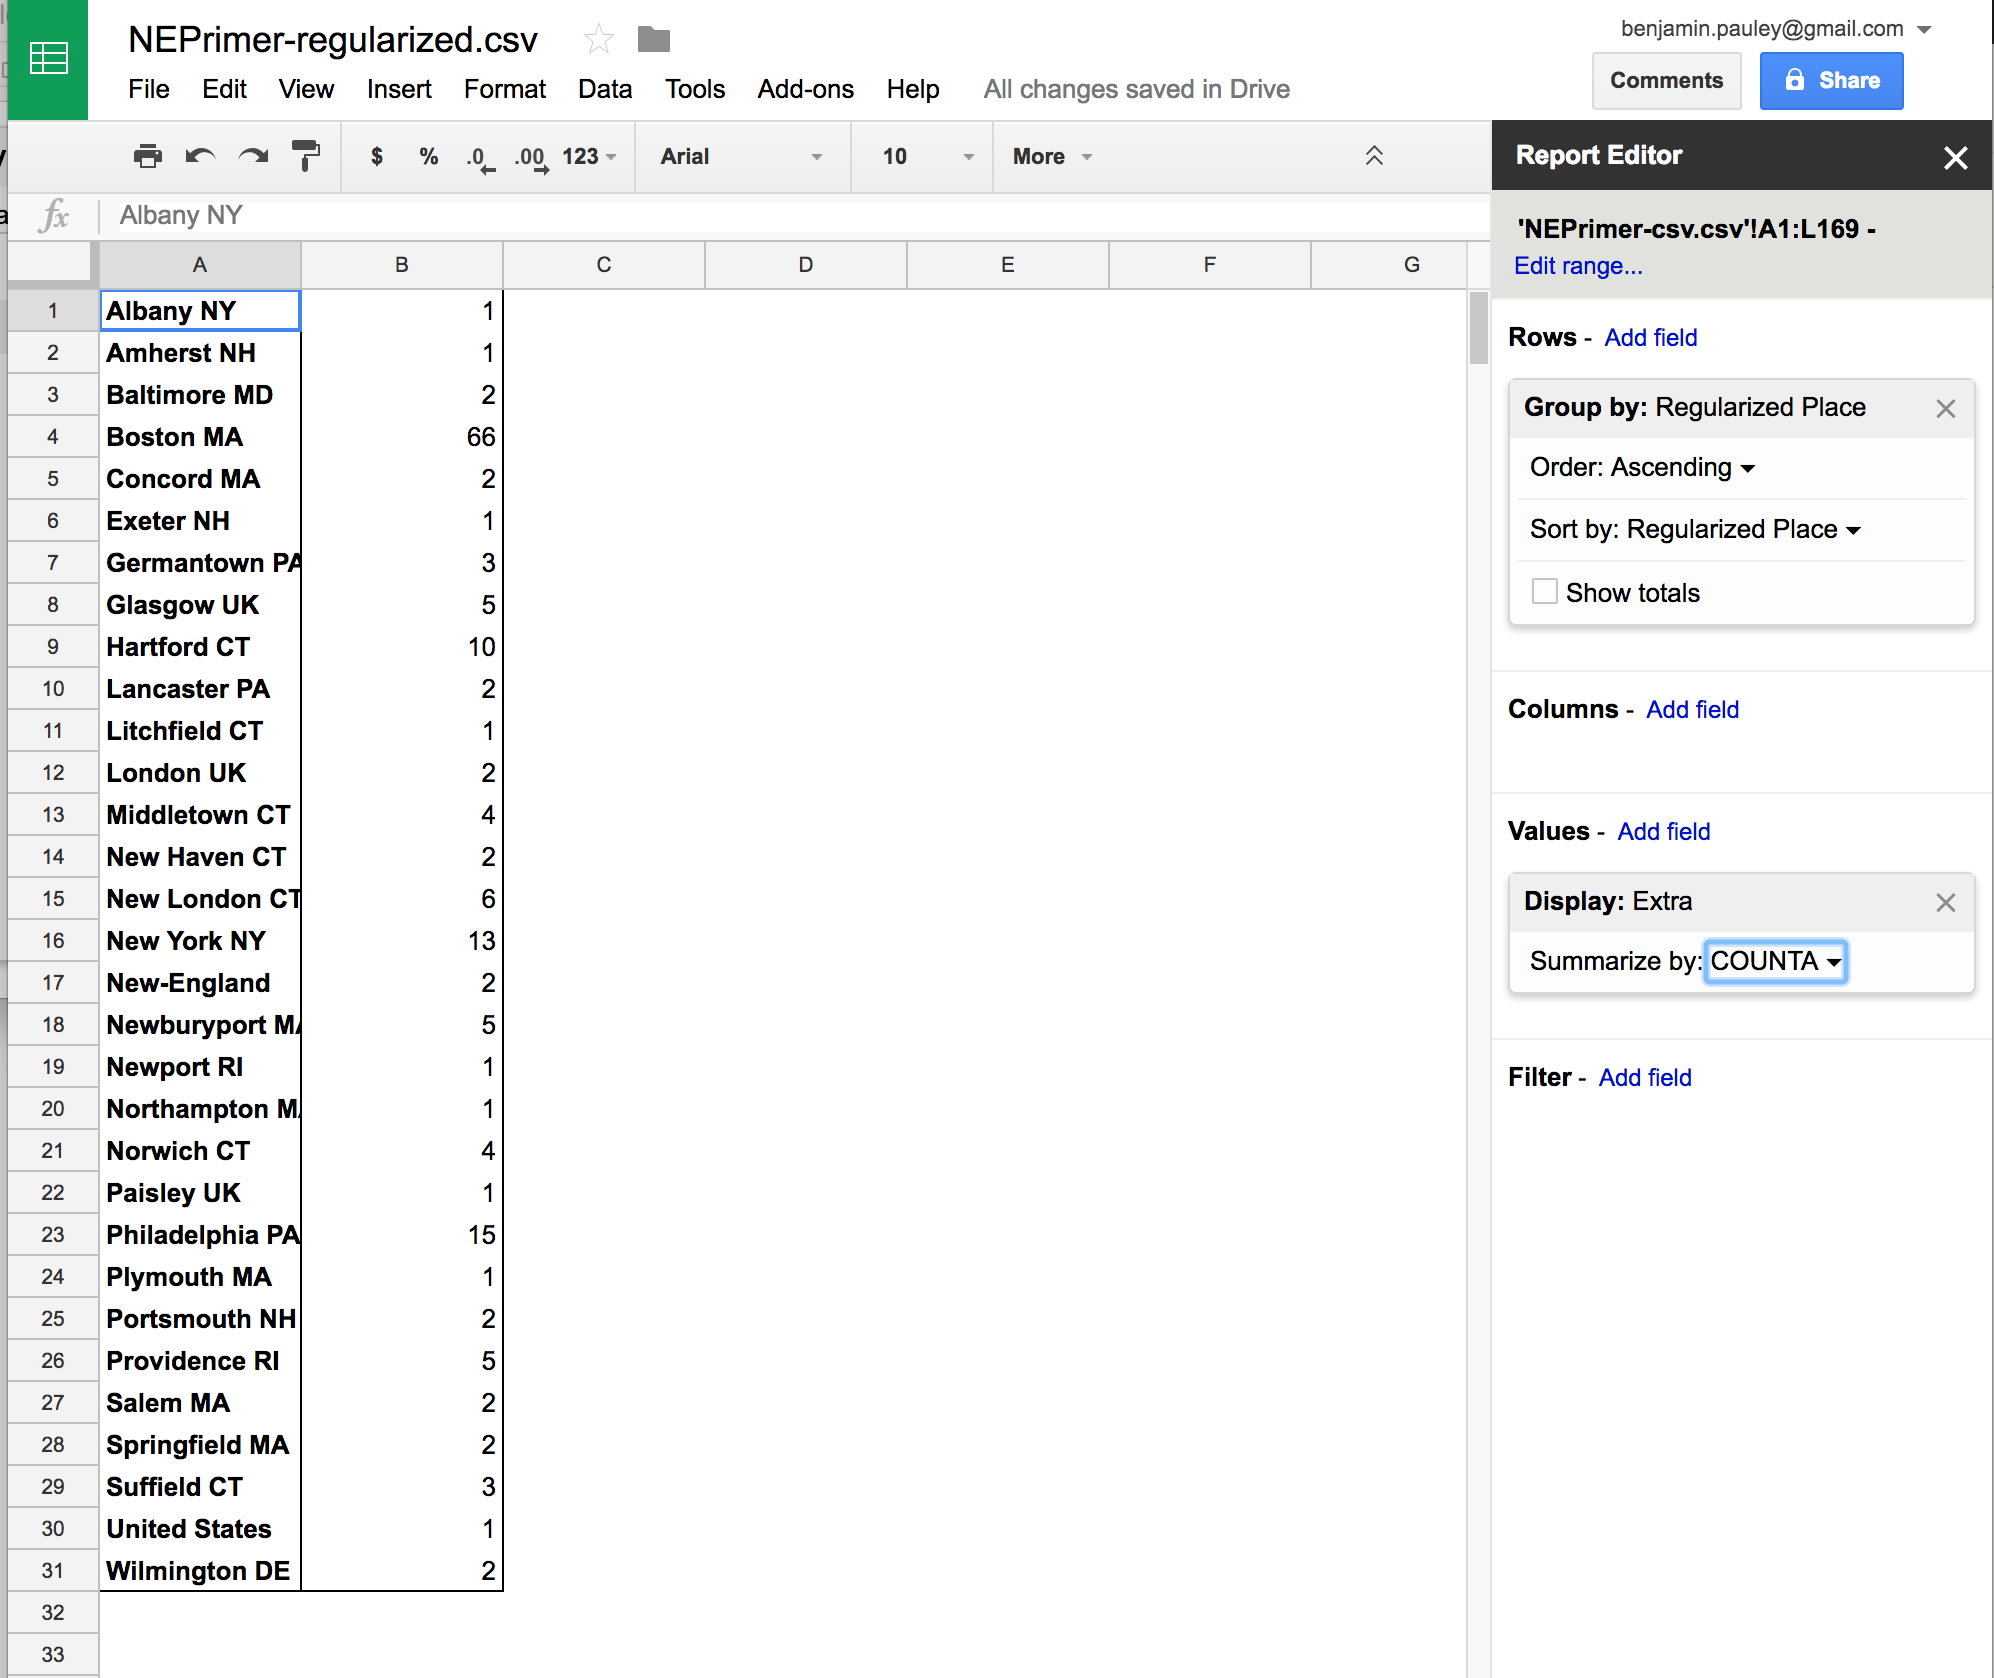
Add a row at the top of your pivot table to provide some column headings (“City” and “Count”), then select “File > Download as > Comma-separated values (.csv, current sheet),” because we’re heading back to Open Refine.
Step 6: Getting latitude and longitude data for our cities in Open Refine
Back in Open Refine, create a new project using the .csv file you just downloaded from Google Sheets (the one with your unique cities and their counts). (Click on the Open Refine logo to get back to the start screen and create the new project just as you did the one back in Step 4. Remember Step 4? Good times…)
This next part may seem daunting, but for our purposes it’s just about following a recipe. A recipe provided by Meitar Moscovitz at the Open Refine wiki, as it happens.
Click on the triangle at the top of your “City” column and select “Edit column” then “Add column by fetching URLs…”:
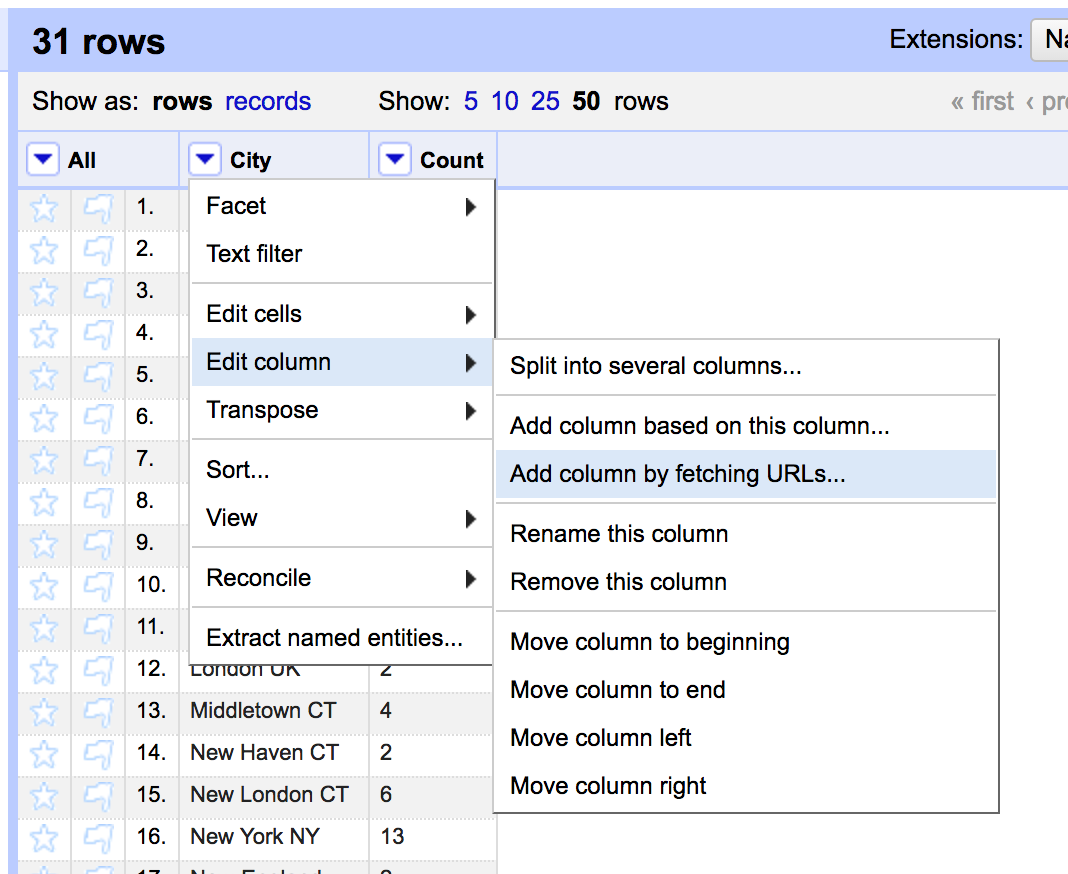
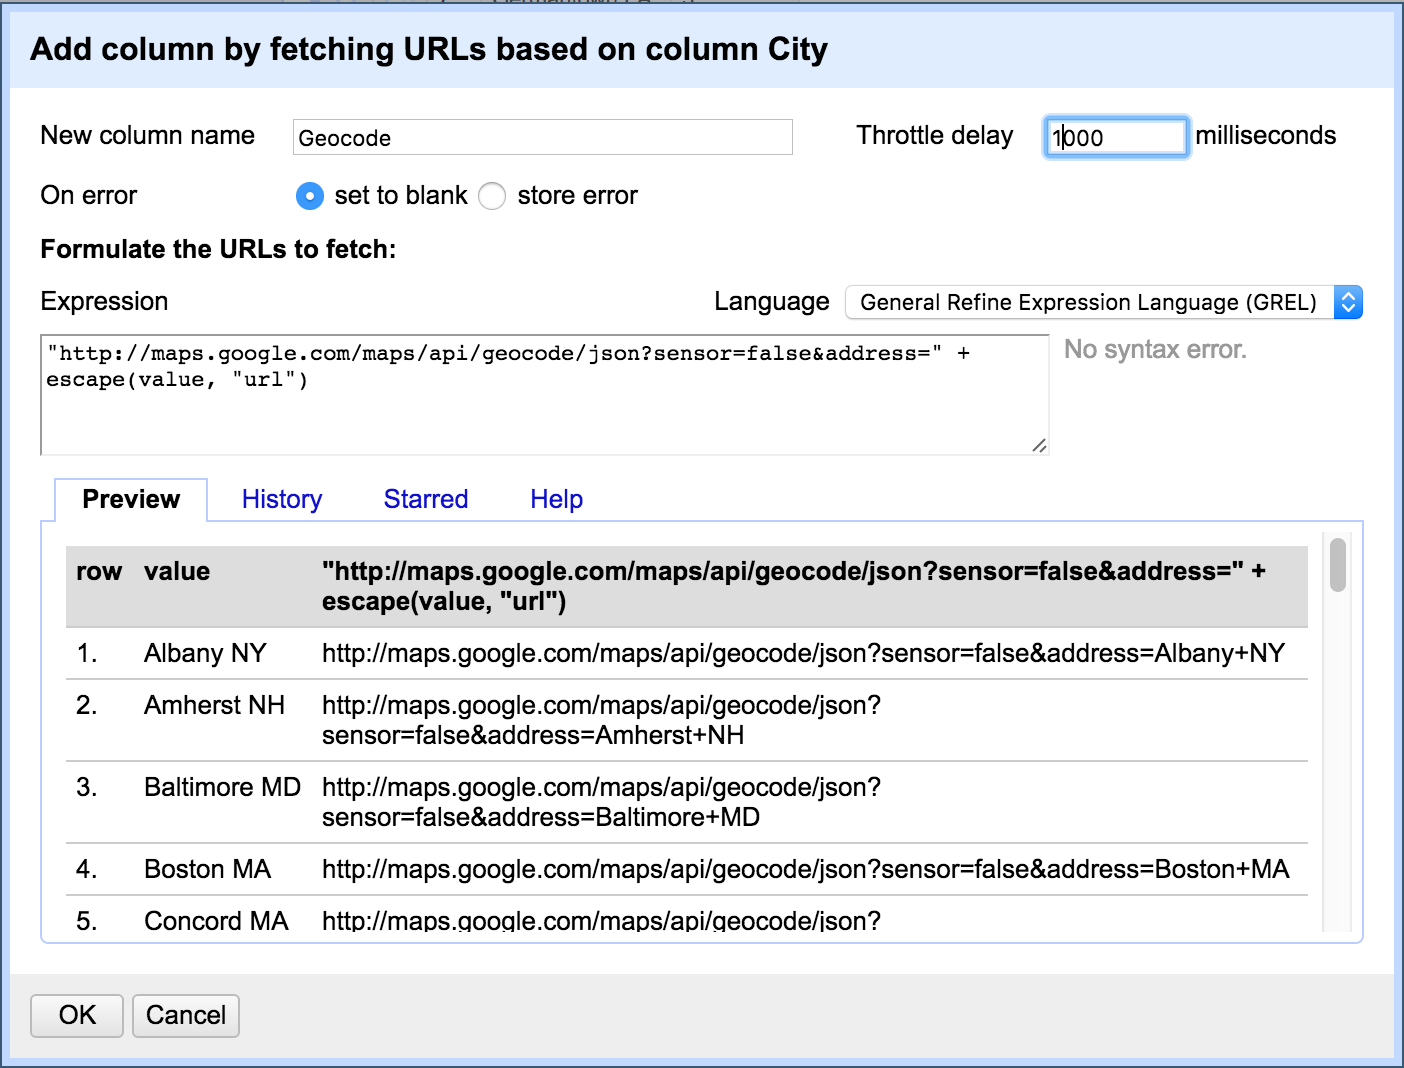
Give this new column a name (I’m using “Geocode”) then, where it says “value,” paste in the following code:
"http://maps.google.com/maps/api/geocode/json?sensor=false&address=" + escape(value, "url")
All that’s happening here is that we’re constructing a URL for Google Maps’ Geocoding API: the first part is set (from “http://maps.google.com” all the way to “&address=”). The second part takes the “value” of the cell that we’re transforming and encodes it for use as a URL (so “Boston MA” is going to be turned into the URL http://maps.google.com/maps/api/geocode/json?sensor=false&address=Boston+MA, for example).
I recommend changing the “Throttle delay” from 5000 milliseconds to something shorter—say, 1000 milliseconds. (This just inserts a pause between requests, but the longer the pause the longer we have to wait for our results. Google’s servers can stand up to your hitting them more often than once every five seconds.)
When you’re ready, hit “OK” and wait for your screen to fill up with some intimidating-looking data. Don’t worry, it won’t stay there long.
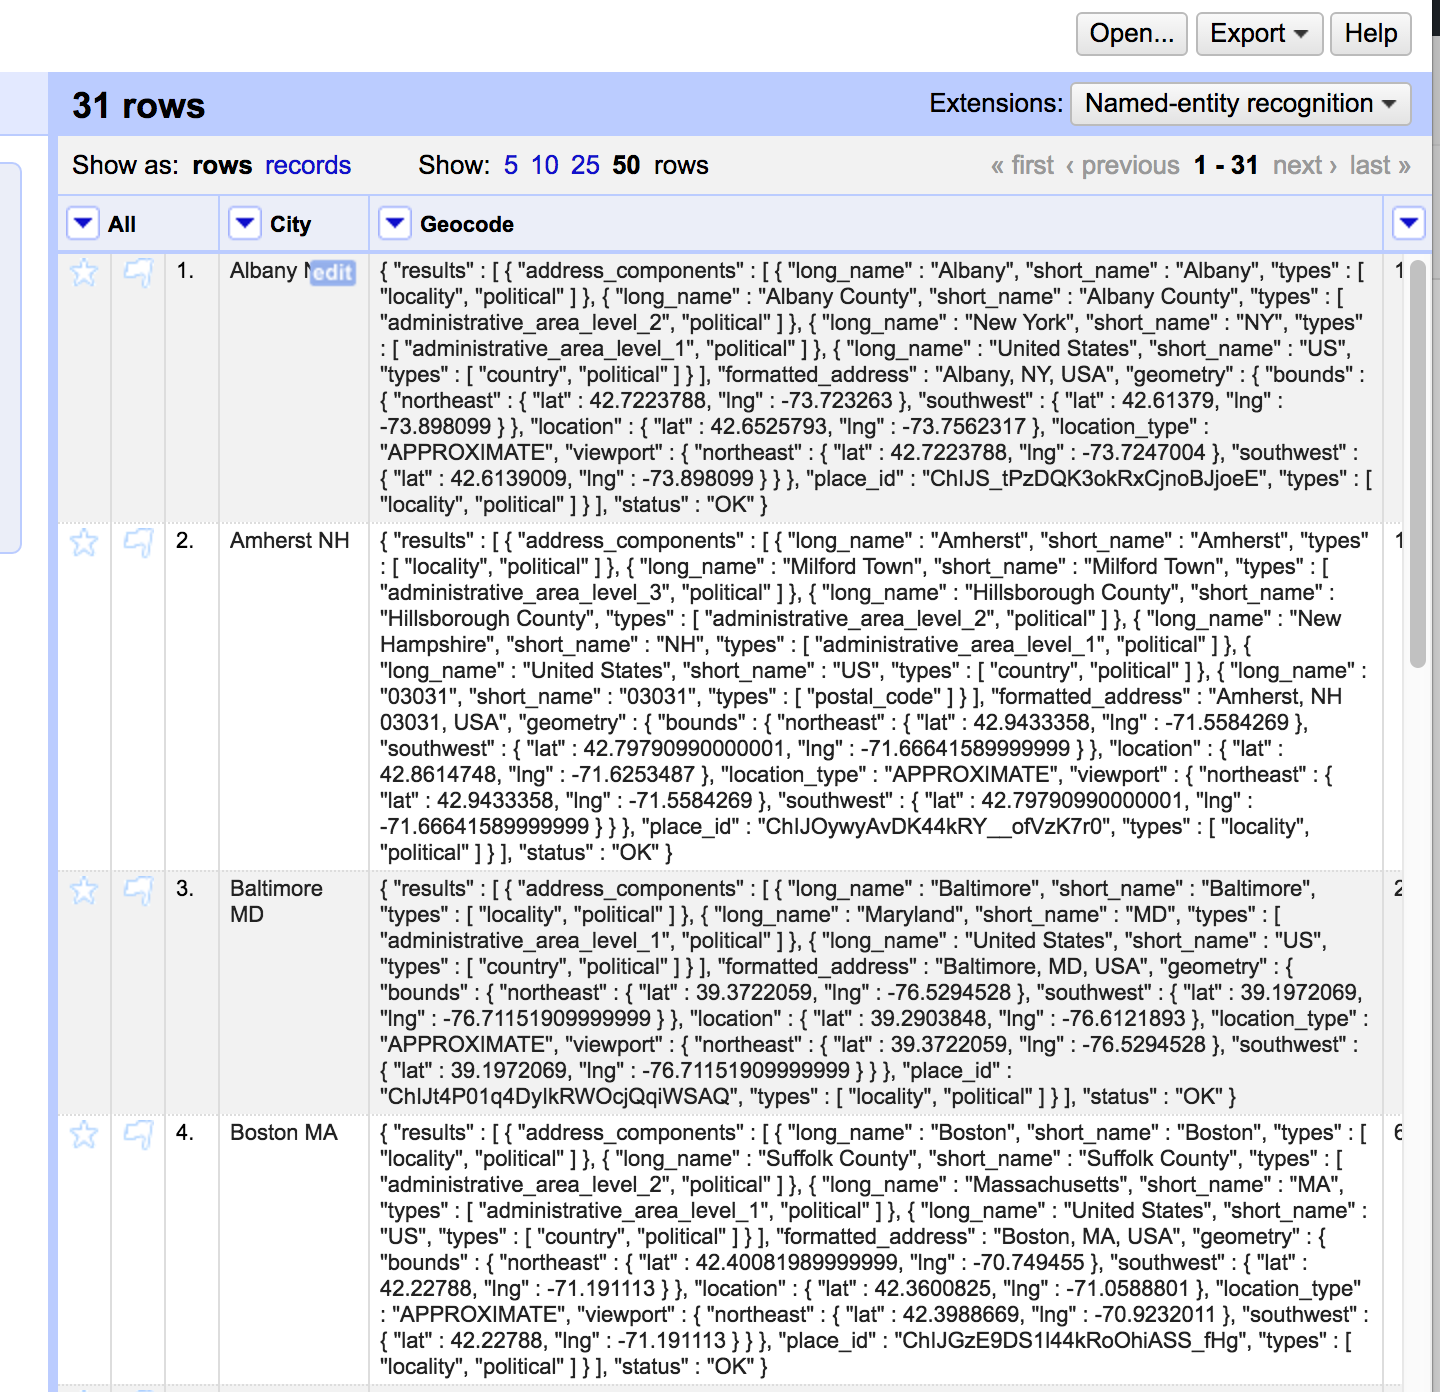
Click the triangle at the top of the “Geocode” column, then select “Edit column” and “Add column based on this column…”. Give your new column a name (I’m using “LatLong”), then paste this code into the box where it says “value”:
with(value.parseJson().results[0].geometry.location, pair, pair.lat +", " + pair.lng)
You’ll get a preview of what’s coming: this code parses the JSON data to extract just the latitude and longitude. Hit “OK” to finish processing. When you’re back to the Open Refine window, click the small triangle at the top of the “Geocode” column, then select “Edit column” and “Remove this column.” You now have a table with the name of each city, its latitude and longitude, and the number of records associated with it. Click on “Export” at the upper right and download this new table as a .csv file (last one, I promise).
Step 7: Mapping!
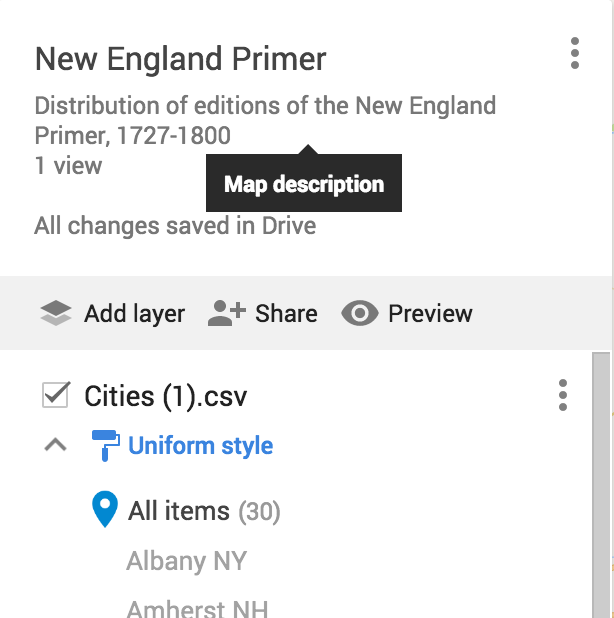
I swear we’re almost done. Go to http://google.com/mymaps (you’ll need to be logged in, but you should be, since you were already using Google Sheets back in Step 5. Remember Step 5? Good ti… Okay, okay…). Click on “Create New Map” and give your new map a title.
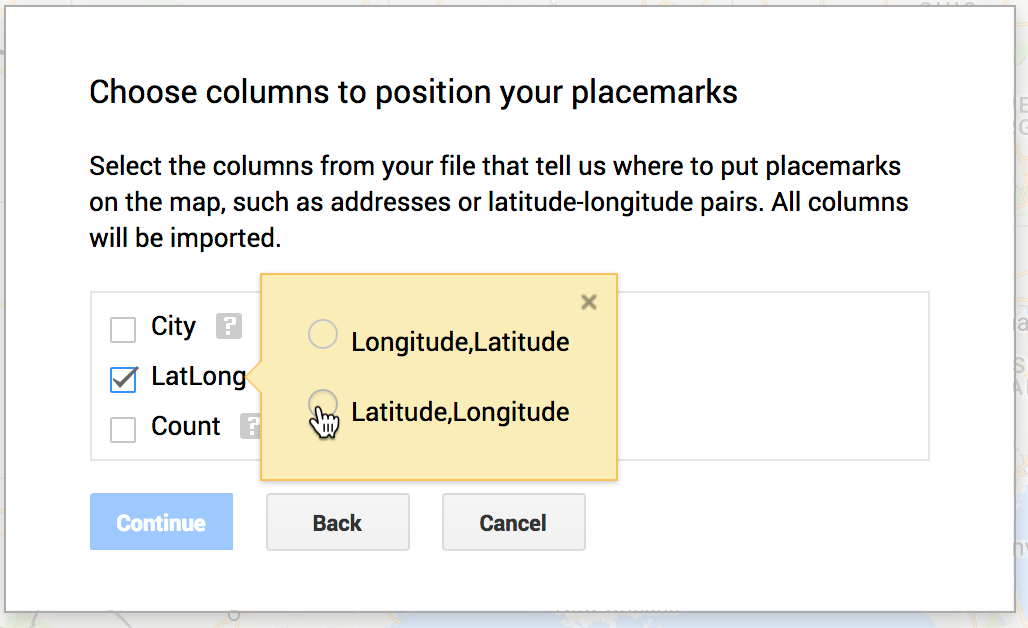
Under “Untitled layer,” click “Import” and upload the .csv file from Step 6. Google Maps will ask you which column to use to place markers on the map. Select your “LatLong” column, clarify that these pairs are in latitude, longitude format, and click “Continue.”
Google Maps will now ask you which column to use as a label. Select your “City” column and click “Finish.” You’ll now see a bunch of markers appear on your map. Each one will have a label and rows giving the latitude and longitude as well as the count. (Any column you put in your .csv file will be displayed in the information box, so you could get clever with the contents.)
You may now perform a happy chair dance.
Step 8: Embedding your map
This is just gravy. Like pretty much anything else you make with Google’s services, you can embed this map elsewhere, but you have to get a couple of settings right.
Click the “Share” icon:
Where it says “Private” click “Change…” and select “On – Public on the web” and click “Save.” Now, click on the three vertical dots to the right of your map’s title and select “Embed on my site,” copy the iframe tag and—in “Text” editing mode at your WordPress blog—[drumroll, please]: Embed. That. Map.